10-K: Annual report [Section 13 and 15(d), not S-K Item 405]
Published on March 7, 2025
UNITED STATES
SECURITIES AND EXCHANGE COMMISSION
Washington, D.C. 20549
FORM
(Mark One)
ANNUAL REPORT PURSUANT TO SECTION 13 OR 15(d) OF THE SECURITIES EXCHANGE ACT OF 1934 |
|
For the fiscal year ended |
|
TRANSITION REPORT PURSUANT TO SECTION 13 OR 15(d) OF THE SECURITIES EXCHANGE ACT OF 1934 |
|
For the transition period from to . |
Commission File Number:

(Exact Name of Registrant as Specified in its Charter)
|
(State or other jurisdiction of incorporation or organization) |
(I.R.S. Employer Identification No.) |
(Address of principal executive offices, including zip code)
(
(Registrant’s telephone number, including area code)
Securities registered pursuant to Section 12(b) of the Act:
Title of Each Class |
Trading Symbol(s) |
Name of Each Exchange on Which Registered |
||
The |
Securities registered pursuant to Section 12(g) of the Act: Warrants to purchase Common Stock
Indicate by check mark if the registrant is a well-known seasoned issuer, as defined in Rule 405 of the Securities Act. Yes ☐
Indicate by check mark if the registrant is not required to file reports pursuant to Section 13 or Section 15(d) of the Act. Yes □
Indicate by check mark whether the registrant (1) has filed all reports required to be filed by Section 13 or 15(d) of the Securities Exchange Act of 1934 during the preceding 12 months (or for such shorter period that the registrant was required to file such reports), and (2) has been subject to such filing requirements for the past 90 days.
Indicate by check mark whether the registrant has submitted electronically every Interactive Data File required to be submitted pursuant to Rule 405 of Regulation S-T (§ 232.405 of this chapter) during the preceding 12 months (or for such shorter period that the registrant was required to submit such files).
Indicate by check mark whether the registrant is a large accelerated filer, an accelerated filer, a non-accelerated filer, a smaller reporting company, or an emerging growth company. See the definitions of “large accelerated filer,” “accelerated filer,” “smaller reporting company,” and “emerging growth company” in Rule 12b-2 of the Exchange Act.
Large accelerated filer |
☐ |
☒ |
|
|
|
|
|
Non-accelerated filer |
☐ |
Smaller reporting company |
|
|
|
|
|
|
|
Emerging growth company |
If an emerging growth company, indicate by check mark if the registrant has elected not to use the extended transition period for complying with any new or revised financial accounting standards provided pursuant to Section 13(a) of the Exchange Act. ☐
Indicate by check mark whether the registrant has filed a report on and attestation to its management’s assessment of the effectiveness of its internal control over financial reporting under Section 404(b) of the Sarbanes-Oxley Act (15 U.S.C. 7262(b)) by the registered public accounting firm that prepared or issued its audit report.
If securities are registered pursuant to Section 12(b) of the Act, indicate by check mark whether the financial statements of the registrant included in the filing reflect the correction of an error to previously issued financial statements.
Indicate by check mark whether any of those error corrections are restatements that required a recovery analysis of incentive-based compensation received by any of the registrant’s executive officers during the relevant recovery period pursuant to § 240.10D-1(b). ☐
Indicate by check mark whether the registrant is a shell company (as defined in Rule 12b-2 of the Exchange Act). Yes
The aggregate market value of common stock held by non-affiliates of the registrant as of June 30, 2024 was $
As of February 28, 2025, there were
DOCUMENTS INCORPORATED BY REFERENCE
Portions of the registrant’s proxy statement for the 2024 Annual Meeting of Stockholders are incorporated herein by reference in Part III of this Annual Report on Form 10-K where indicated. Such proxy statement will be filed with the U.S. Securities and Exchange Commission within 120 days of the registrant’s fiscal year ended December 31, 2024.
TABLE OF CONTENTS
2
FORWARD-LOOKING STATEMENTS
References to the “Company,” “Cryoport,” “we,” “us,” “our” and other similar words refer to Cryoport Inc. and its consolidated subsidiaries, unless the context suggests otherwise. This Annual Report on Form 10-K (this “Form 10-K”) contains certain forward-looking statements. These forward-looking statements involve a number of risks and uncertainties. These forward-looking statements can generally be identified as such because the context of the statement will include certain words, including but not limited to, “believes,” “may,” “will,” “expects,” “intends,” “estimates,” “anticipates,” “plans,” “seeks,” “continues,” “predicts,” “potential,” “likely,” or “opportunity,” and also contains predictions, estimates and other forward-looking statements within the meaning of Section 27A of the Securities Act of 1933, as amended (the “Securities Act”), and Section 21E of the Securities Exchange Act of 1934, as amended (the “Exchange Act”), and in reliance upon the safe harbor provisions of the Private Securities Litigation Reform Act of 1995. Such forward-looking statements are based on the current beliefs of the Company’s management, as well as assumptions made by and information currently available to the Company’s management. Readers of this Form 10-K should not put undue reliance on these forward-looking statements, which speak only as of the time this Form 10-K was filed with the Securities and Exchange Commission (the “SEC”). Reference is made in particular to forward-looking statements regarding our expectations about future business plans, new products or services, regulatory approvals, strategies, development timelines, prospective financial performance and opportunities, including potential acquisitions; expectations about future benefits of our acquisitions and our ability to successfully integrate those businesses and our plans related thereto; liquidity and capital resources; plans relating to our cost reduction and capital realignment measures and expectations about resulting annual cost savings and financial impact; assumptions relating to the impairment of assets; plans relating to any repurchases of our common stock and/or convertible notes; projected trends in the market in which we operate; our expectations relating to current supply chain impacts; inflationary pressures and the effect of foreign currency fluctuations; anticipated regulatory filings or approvals with respect to the products of our clients; expectations about securing and managing strategic relationships with global couriers or large clinical research organizations; our future capital needs and ability to raise capital on favorable terms or at all; results of our research and development efforts; and approval of our patent applications.
Although we believe that our opinions and expectations reflected in the forward-looking statements are reasonable as of the date of this Form 10-K, we cannot guarantee future results, levels of activity, performance or achievements, and our actual results may differ substantially from the views and expectations set forth in this Form 10-K. You should be aware that these statements are projections or estimates as to future events and are subject to a number of factors that may tend to influence the accuracy of the statements, including, but not limited to, risks and uncertainties associated with the effect of changing economic and geopolitical conditions, supply chain constraints, inflationary pressures, and the effects of foreign currency fluctuations, trends in the products markets, variations in the Company’s cash flow, market acceptance risks, and technical development risks. Other factors that might cause such a difference include, but are not limited to, those discussed in this Form 10-K, including in “Risk Factors” in “Part I, Item 1A — Risk Factors” and in “Part II, Item 7 — Management’s Discussion and Analysis of Financial Condition and Results of Operations,” as well as those discussed in reports filed with the SEC after the date of this Form 10-K.
Past financial or operating performance is not necessarily a reliable indicator of future performance, and you should not use our historical performance to anticipate results or future period trends. We can give no assurances that any of the events anticipated by the forward-looking statements will occur or, if any of them do, what impact they will have on our results of operations and financial condition. Except as required by law, we do not undertake to update any such forward-looking statements and expressly disclaim any duty to update the information contained in this Form 10-K.
3
PART I
Item 1. Business
Overview
We are global leader in integrated temperature-controlled supply chain solutions for the life sciences industry, with a strong focus on supporting the Cell and Gene Therapy market (CGT). Our broad array of products and services are designed to mitigate risks and ensure the safe and reliable storage and delivery of critical therapies and other high value biologic materials. We support the entire continuum from biomaterial collection to final delivery, ‘Enabling the Future of MedicineTM.
Our integrated supply chain platform leverages advanced temperature-controlled packaging, systems, and informatics to deliver essential solutions for companies in the CGT ecosystem, including:
| ● | BioLogistics services |
| ● | BioStorage/BioServices |
| ● | Cryopreservation services |
| ● | Cryogenic systems |
We have a market leading role in supporting the CGT market and other markets in the life sciences industry that require comprehensive, technology-centric supply chain solutions for high-value products and materials.
| • | As of December 31, 2024, we supported 701 clinical trials and 19 commercial cell and gene therapies. |
| • | Our integrated solutions help ensure the integrity of cellular material throughout the supply chain from the time biological materials are extracted from the patient for the cell and gene manufacturing process to the delivery of the therapies to the point of care. |
| • | These solutions include BioLogistics, BioServices, and Cryopreservation services, all of which are critical for the development and delivery of these lifesaving therapies. |
| • | Our newly introduced Cryopreservation services (IntegriCell®) provide enhanced cryopreservation and characterization services to maintain the quality of cellular therapy starting materials. |
| • | Our informatics, led by the Cryoportal® Logistics Management Platform, provides visibility of real-time monitoring and tracking and Chain-of-Compliance®. It also provides the process control and information that ensures quality and regulatory compliance. The Cryoportal® Logistics Management Platform has integration capabilities with clients, partners and vendors through Application Program Interfaces (API). |
| • | MVE Biological Solutions, the global leader for cryogenic systems used in the life sciences for storage and transportation, is known for its reliability, safety, high-quality manufacturing, and innovation. This inhouse manufacturing capability protects Cryoport Systems by ensuring the reliable supply of essential purpose-built cryogenic equipment and technology that enables us to quickly scale our services capabilities as the CGT market grows and expands worldwide. |
We have a global presence through our directly operated global supply chain centers, logistics centers and depots, biostorage/bioservices, and cryoprocessing centers. We have partner networks in the Americas, EMEA (Europe, the Middle East, and Africa) and APAC (Asia-Pacific) regions. In addition, our MVE Biological Solutions business unit operates three cryogenic systems manufacturing centers in the U.S. (2) and China (1).
The Markets We Serve
We are an integrated temperature-controlled supply chain solutions and have developed industry-leading products and services that seamlessly integrate into a comprehensive supply chain platform supporting the life sciences market, including the biopharma/pharma, animal health, and reproductive medicine markets. With a historical focus on biopharmaceuticals, high-value temperature-controlled products and commodities, animal health vaccines, and reproductive medicine materials, we have developed best practices and industry standards for these critical areas within the life sciences supply chain.
4
In the biopharmaceutical space, we have concentrated on emerging fields, particularly cell and gene therapies. These therapies are among the most sensitive pharmaceutical products, requiring stringent distribution standards supported by informatics
Cryoport Products and Services
We continuously work to expand and improve our products and services across the life sciences supply chain with innovative, technology-centric solutions.
Our suite of market leading products and services include, but are not limited, to the following:
Cryoport Express® Shippers - Cryoport Express® Shippers range from liquid nitrogen dry vapor shippers (-150℃) to our C3™ Shippers (2-8℃), which are powered by phase-change materials. The Cryoport Express® Shippers are precision-engineered assemblies that are reliable, cost-effective, and reusable or recyclable. Our liquid nitrogen dry vapor Cryoport Express® Shippers utilize an innovative application of ‘dry vapor’ liquid nitrogen technology and, most often, include a SmartPak™ Condition Monitoring System. Cryoport Express® Shippers meet IATA requirements for transport, including Class 6.2 infectious substances, are also ISTA (International Safe Transit Association) “Transit Tested” certified and carry the “CE” (“Conformité Européenne”) mark demonstrating conformance with European Union (“EU”) health, safety, and environmental protection standards.
Cryoport ELITE™ Shippers - The first product, in this high-performance line of Cryoport ELITE™ Shippers, is a best-in-class -80°C shipper that has superior temperature management properties as well as incorporating next generation protection, handling, and data collection and management systems including our SmartPak™ Condition Monitoring System. The Cryoport ELITE™ -80°C Gene Therapy Shipper was developed in conjunction with one of the leaders in the gene therapy space for clinical and commercial gene therapy distribution and was launched during the second quarter of 2023.
Cryoport Express® Cryogenic HV3 Shipping System (HV3) – During the first quarter of 2025, we introduced the HV3 which provides optimized hold times for interior payloads, improved storage efficiency, and full compliance with airline requirements including narrow bodied aircraft. Tailored to meet the specific needs of advanced therapies, the HV3 ensures enhanced payload security, superior temperature control, payload integrity and extended temperature stability at cryogenic temperatures. Its innovative enclosure design and configuration eliminates the need for palletization on narrow-bodied aircraft, ensuring compliance with regional carriers and reducing flight rejections and delays. This enhancement also opens additional shipping lanes, making it easier for life-saving therapies to reach more remote destinations. Designed with the end-user in mind, the HV3 features robust wheels and an integrated, front-facing handle to ensure easy mobility at any stage of transit.
Smartpak II® Condition Monitoring System and Tec4Med – Cryoport’s Smartpak II® Condition Monitoring System (“Smartpak II®”) delivers comprehensive visibility into the location and conditions of valuable materials throughout the entire shipment process. The system also provides critical data to validate that sample integrity is maintained during transit. The Smartpak II® monitors key parameters, including location, temperature, shock, orientation, and pressure, with immediate alerts enabling swift intervention when necessary. Seamlessly integrating with our Cryoportal® Logistics Management Platform, the Smartpak II® provides visibility of near real-time reporting, combining condition monitoring, logistics management, and shipper qualification performance into a single data stream for enhanced oversight and reliability.
We acquired Tec4Med, a company providing cold-chain packaging temperature and location monitoring, warehouse monitoring as well as bench top monitoring for laboratories and research facilities during the fourth quarter of 2023. Technological innovations from Tec4Med include:
| • | The SmartHub is an intelligent Beacon-Gateway Monitoring System and can be integrated into any logistics process at box, pallet, container, truck or warehouse level. In doing so, it enables full supply chain visibility in real-time. |
| • | The CryoBeacon serves as an intelligent temperature and humidity data logger with advanced capabilities. It effectively records all data internally and offers two methods of data retrieval: manual access through the Tec4App and automated retrieval via the SmartHub gateway. Designed for multiple applications, the CryoBeacon can be utilized repeatedly for different shipments. |
With our solutions, our clients have the peace of mind that comes with knowing exactly where their shipments are, at all times, ensuring that they can deliver high-quality pharmaceutical products to their clients with confidence. By adopting risk mitigation measures, our clients can proactively identify and address potential threats to their operations and supply chain. This saves valuable resources that can be redirected toward other critical areas of their business, allowing them to operate
5
more efficiently and effectively. Through Tec4Med technology, they can optimize their operations and build a more resilient business for the long term. We intend to leverage the Tec4Med technology across many of Cryoport’s products and services in the coming years.
Cryoport accessories – Our purpose-built accessories are integral to our comprehensive integrated temperature-controlled supply chain solutions. Designed to seamlessly integrate with our advanced shipping systems, our accessories safeguard materials and minimize risks at every stage of s their journey—spanning critical phases of development and manufacturing. From our proprietary Safepak® and SoftRackTM Systems to specialized labels, cassette racks and cryovial boxes, each accessory is meticulously engineered to help ensure security and preserve the integrity of critical therapies and biomaterials throughout the supply chain. Our accessories include: Safepak® System 1800, Safepak® XL, Soft Rack™, Cryostrap®, and Cryoport Elite® Ultra Cold Shipping Systems' Payload Holding System among others.
Cryoport BioStorage/Bioservices – We offer biostorage and bioservices solutions through two of our business units, CRYOGENE and Cryoport Systems.
CRYOGENE - Acquired in 2019, CRYOGENE provides biostorage solutions primarily for the provision of pre-clinical temperature-controlled biological materials management services to the life sciences industry. With a focus on pre-clinical commodities, it is one of the medical research industry’s leading biorepository, focusing on the secure storage of biological specimens and associated supplies. Utilizing the latest freezer and cryogenic storage technologies and computer inventory control software, CRYOGENE can cost-effectively fulfill life sciences bio-storage and distribution requirements. Our services include comprehensive specimen storage, processing, collection, and retrieval at our CRYOGENE operations in Houston, Texas, and San Antonio, Texas, the latter which was opened during the first quarter of 2024. Both facilities are FDA registered for storage and distribution and compliant with Current Good Tissue Practice (CGTP), Current Good Manufacturing Practices (cGMP), and the American Association of Tissue Banks (AATB). In January 2025, we announced a strategic partnership with the Moffitt Cancer Center (MCC), a leading National Cancer Institute-designated comprehensive cancer center, whereby CRYOGENE will establish a state-of-the-art biorepository center in conjunction with MCC’s planned 775-acre global innovation life sciences campus in Pasco County, Florida. CRYOGENE facilities in Florida are expected to be fully validated and open during the second half of 2026.
| ● | Cryoport Systems Bioservices - In June 2022, we launched its first two Global Supply Chain Centers in Houston, Texas and Morris Plains, New Jersey. These state-of-the-art facilities combine our existing logistics processes and capabilities with our BioServices infrastructure – all under one roof, as Cryoport Systems’ Global Supply Chain Center Network. These Global Supply Chain Centers offer a new and fully integrated approach designed to support cell and gene therapies including comprehensive controlled temperature storage, kitting, labelling, fulfillment, sample management, drug return, and Qualified Person (QP) drug product release, along with advanced BioLogistics. Cryoport Systems’ BioServices facilities in the United States are registered with the FDA as Tissue Establishments, complying with FDA CFR 1271.10. In April 2022, we acquired Cell&Co BioServices in Clermont-Ferrand, France with additional bioservices operations in Pont-du-Château, France to accelerate the setup of our BioServices capabilities in the EMEA region. Our sites are ISO 9001 and ISO 20387 accredited and all GMP IT systems are 21CFR Part 11, and GAMP-5 compliant (both US and EU). |
Cryopreservation Services (IntegriCellTM) - In conjunction with our acquisition of Cell Matters in July 2022, we developed our IntegriCellTM service platform. The IntegriCellTM platform is a fully standardized, scalable apheresis cryo-processing platform that can be expanded on a global basis. The platform services include apheresis/leukapheresis collection via partners, CryoshuttleTM transportation services, cryo-process optimization, cryopreservation services, and BioServices. We have recently opened our first two facilities in Liège, Belgium and Houston, Texas. These two facilities became operational during the fourth quarter of 2024.
Cryoport Consulting Services – Cryoport Consulting Services functions in an expert advisory capacity to offer solutions to address risk factors present in temperature-controlled supply chain and logistics. To develop tailored scalable solutions, our cross-functional team collaborates with our clients to understand their supply chain, logistics, time, shipper, and packaging concerns. Cryoport Consulting Services employs a structured approach to managing, executing, and developing risk mitigation plans. Our clients benefit from our quality driven processes and solutions delivered by our high integrity team leveraging industry-standard best practices and years of experience partnering with leading life science companies from early clinical through post-commercialization. Service solutions range from comprehensive physical, thermal and shipping qualifications of shipping systems and/or packaging to developing user-friendly custom packaging solutions focused on the challenges unique to our life science clients.
6
CRYOPDP Temperature-controlled Logistics - CRYOPDP is a premier global specialty courier dedicated to the life sciences industry that we acquired in 2020. CRYOPDP operates with expertise an exhaustive range of temperature-controlled logistics services including temperature-controlled packaging and premium transport solutions. In recent years, CRYOPDP further expanded organically as well as through acquisitions in Ireland, Belgium, Spain, Australia and the United States. Through the acquisition of CRYOPDP, we expanded our global presence and provided Cryoport with inhouse specialty courier capabilities to complement our network of global partners.
MVE Biological Solutions - The acquisition of MVE Biological Solutions in 2020 enabled Cryoport to become the leading global provider of cryogenic systems and solutions. MVE Biological Solutions supplies cryogenic systems globally and is an important part of our global supply chain platform. With its long history of producing the most reliable, highest quality products in the industry, it has set the standard for the manufacture of cryogenic systems including freezer, and shipper solutions used for storage and/or distribution of critical biological material, for 60 years. Two examples of MVE Biological Solutions advance development achievements are:
| ● | MVE Biological Solutions’ Fusion® Cryogenic System – The MVE Fusion is a self-sustaining cryogenic freezer. The MVE Fusion® can operate as a stand-alone unit, requiring no on-going liquid nitrogen supply or connection to an external liquid nitrogen source. Fusion® cryogenic freezers are a perfect solution for remote geographic locations, isolated laboratories, high elevation facilities, or facilities without existing liquid nitrogen infrastructure. |
| ● | MVE Biological Solutions’ Vario® Cryogenic System – is an innovative cryogenic freezer system that can support temperatures anywhere between -20°C and -150°C. In addition to providing greater flexibility, the Vario® series of cryogenic freezer systems provide effective and consistent temperature profiles with less than 1% of the power consumption and a 70% reduction in overall operating cost savings compared to traditional mechanical freezers. |
Competitive Advantages
With our first-to-market integrated platform of technology-driven supply chain solutions serving the life sciences industry, we have established a lead over potential competitors by focusing on de-risking critical processes in the life sciences including those central to the manufacture and distribution of cell and gene therapies. Working with our in-depth knowledge of information technology, cryopreservation services, packaging, temperature-controlled logistics, BioServices, and cryogenic systems, our management, technical, business development and service support teams approach our growing markets with valued insights, adaptability, innovation, and a mindset of problem resolution which provides clients with certainty of performance.
Through our experience, we know that supply chain processes can have a large impact on temperature sensitive product/commodity conditions. We therefore seek to exceed the most demanding standards in the industry, such as, among others, ISO 13485, ISO 21973, ISO 9001, ISTA, and IATA.
Cryoport Systems’ Cryoportal® Logistics Management Platform (Cryoportal®) is an important backbone technology. The Cryoportal® handles order entry, keeps track of our global inventory, and provides algorithms for predictive analysis on every shipment while in transit, globally. Cryoport Systems’ customer service team monitors every in-transit shipment 24/7/365 and, by leveraging the Cryoportal®, they have the unique ability to see issues that arise and take corrective measures up to and including intervention to potentially save a shipment in trouble.
A key driver in differentiating our service platform is the fact that we are the only organization that has a fully integrated supply chain platform that encompasses products, services, and informatics within a single organization which is anchored by our Chain of Compliance® solution. Our integrated temperature-controlled supply chain solutions are built for purpose, fully integrate products, services, and informatics and are focused on the management of irreplaceable therapies, vaccines, and biological materials such as biological samples and reproductive materials.
Segment Reporting
Operating segments are identified as components of an enterprise about which separate discrete financial information is available for evaluation by the chief operating decision maker in making decisions regarding resource allocation and assessing performance. The chief operating decision maker is our Chief Executive Officer.
7
Effective in the fourth quarter of 2024, the Company realigned the reportable segment information that the CODM regularly reviews to evaluate the business, make key operating decisions and allocate resources which resulted in the identification of two reportable segments: Life Sciences Services and Life Sciences Products. Previously the Company had one reportable segment and the CODM utilized consolidated financial results to evaluate performance and has transitioned to utilizing disaggregated financial information between the Life Sciences Services and Life Science Products segments.
Adjusted earnings before interest, income taxes, depreciation and amortization (“adjusted EBITDA”) for each operating segment is the profit measure used by the CODM in measuring the performs of the business and in the annual budget and forecasting process. Adjusted EBITDA is defined by the Company as earnings before interest, income taxes, depreciation, amortization and certain items that do not contribute directly to management’s evaluation of its operating results. Asset information by reportable segment is not provided to the CODM.
We have three operating segments that are aggregated as Life Sciences Services which provides temperature-controlled logistics and cryogenic biostorage within the life science industry through direct sales. Revenues from this segment include an immaterial amount of product revenues. The Company’s Life Sciences Products segment manufactures and sells cryogenic freezers, cryogenic dewars and accessories within the life science industry through direct sales or a distribution network. Revenues from this reportable segment are exclusively life sciences product revenues.
In addition, the CODM manages and evaluates the operating performance of the segments, as described above, on a pre-corporate cost allocation basis. Accordingly, for segment reporting purposes, the company does not allocate corporate costs, which include certain aspects of the Company’s executive management, legal, compliance, human resources, information technology and finance departments, to its reportable segments.
Customers and Distribution
We believe that our platform of integrated temperature-controlled supply chain solutions, expertise, and geographic footprint enables us to take advantage of the growing demand for effective and efficient global transport and biostorage of temperature sensitive life sciences commodities. This is especially the case for cell and gene therapies that require tightly controlled temperatures through the development, biostorage, transportation, and delivery processes to maintain efficacy and safety.
During the year ended December 31, 2024, no customer accounted for more than 10% of our total revenues. During the year ended December 31, 2023, one customer accounted for 10.5% of our total revenues. During the year ended December 31, 2022, no single customer accounted for over 10% of our total revenues.
Our geographical revenues, by origin, for the years ended December 31, 2024, 2023 and 2022, were as follows:
2024 |
2023 |
2022 |
|
||||
Americas |
|
55.3 |
% |
54.5 |
% |
54.0 |
% |
Europe, the Middle East and Africa (EMEA) |
|
26.1 |
% |
26.1 |
% |
28.2 |
% |
Asia Pacific (APAC) |
|
18.6 |
% |
19.4 |
% |
17.8 |
% |
Customer types
Our major customer types include Biotechnology and Pharmaceutical Companies, Contract Research Organizations, Contract Development & Manufacturing Companies, Central Laboratories, Fertility Clinics, Animal Health Companies, Universities & Research Facilities.
Sales and Marketing
We serve clients across the life sciences industry, with a particular focus on the rapidly evolving Cell and Gene Therapy market. Our global sales and marketing efforts are centered on addressing each customer’s unique challenges and anticipating their future needs through our specialized temperature-controlled supply chain solutions. Our marketing teams create and execute targeted digital campaigns that align with our commercial strategy, showcasing our innovative portfolio of solutions and capabilities. These initiatives are designed to fuel business development, program management, and consulting activities, while also enhancing awareness of our advanced temperature-controlled supply chain solutions.
8
Competition
We believe Cryoport is unique in its product and services offerings. However, we do have competition from companies that offer products and/or services that could be considered competitive to certain components or elements of our platform of temperature-controlled supply chain solutions, including specialty couriers, such as World Courier Group, Inc., Marken (a UPS company), Biocair and Quick (a Kuehne+Nagel company), along with companies that offer products such as Azenta Life Sciences, and IC Biomedical and services such as the American Red Cross and Gift of Life Biologics. In addition, life science companies may develop their own in-house temperature-controlled supply chain solutions, systems and procedures to cover their specific needs.
Engineering and Development
Our research, development, and engineering efforts are focused on continually investigating new technologies that can improve our services, and the features of our products and solutions in order to address market needs.
Cryoport Data Management Systems
Tec4Med and SkyTrax™ Condition Monitoring Systems - Cryoport’s Tec4Med and SkyTrax™ Condition Monitoring Systems are connected data platforms for the temperature sensitive supply chain. Tec4med provides an integrated suite of hardware and user-friendly software delivering intelligent supply chain data and predictive analytics. The Tec4med eco-system enables end-to-end supply chain visibility and optimization, unifying a digitization of the supply chain. The Tec4Cloud FDA 21 CFR Part 11 compliant web platform delivers actionable supply chain data (including multi-channel alerts) and can be white label customized with client branding. SkyTrax™ is a next generation proprietary-designed Condition Monitoring System, custom-built for the cell and gene industry. In addition to being 4G/LTE compliant, cellular network agnostic, with a full sensor array to track location, temperature, humidity, light, shock, orientation, and geofencing, with Bluetooth and Wi-Fi capabilities. The Cryoport team is currently developing a product roadmap for a unified approach to the suite of condition monitoring solutions.
Cryoportal® 2.0 and UnITy™ - Cryoport Systems’ Cryoportal® 2.0. Logistics Management Platforms was launched during the second quarter of 2023 and is ISO 21973 compliant as a supply chain management platform. In addition to managing all aspects of a given client shipment, it also manages the Chain of Compliance™ based aspects of our packaging. The Cryoportal® 2.0 is complemented by CRYOPDP’s UnITy™ Transportation Management System. UnITy™ provides functionalities in addition to transport management that include warehousing management, quality management, customer experience portal, mobile apps for track and trace during transport and storage as well as integration with transportation agents and business partners. The combination of these two powerful informatics platforms provides Cryoport clients with a comprehensive status of their clinical or commercial distribution activities, while supporting regulatory requirements and further sets Cryoport apart from competition.
Manufacturing and Raw Materials
Manufacturing - We source components for our products from multiple suppliers, including those that manufacture to our engineering specifications, using, in part, proprietary technology and know-how to mitigate supply chain risks. We also use “off-the-shelf” products, which we may modify to meet our requirements. For some components, there are relatively few alternate sources of supply and the establishment of additional or replacement suppliers may or may not be accomplished immediately. When this occurs, we endeavor to mitigate risk by locating an alternative qualified supplier and, as appropriate, increasing our inventory level.
Our vendor/partner relationships allow us to concentrate on further advancing and expanding our platform of systems, products, and solutions for the life sciences to meet the growing and varied demands for validated temperature-controlled solutions in the life sciences industry. We endeavor to keep our supply structure up to date and agile as it provides us the opportunity to rapidly scale to support our client’s commercialization, systems, products, and solutions requirements; however, we are ever mindful of the work we must do to improve our current sourcing and to continue to mitigate risks therein.
Raw Materials - Various raw materials are used in the manufacture of our products and in the development of our technologies. Most raw materials are generally available from several alternate distributors and/or manufacturers. Where we have experienced significant difficulty in obtaining these raw materials, we have established alternative global sources or work with existing suppliers to overcome any deficiencies.
9
Patents, Copyrights, Trademarks, and Proprietary Rights
To remain competitive, we develop and maintain protection on the proprietary aspects of our platform of technologies. We rely on a combination of patents, copyrights, trademarks, trade secret laws and confidentiality agreements to protect our intellectual property rights.
To remain competitive, we develop and maintain protection on the proprietary aspects of our platform of technologies. We rely on a combination of patents, copyrights, trademarks, trade secret laws and confidentiality agreements to protect our intellectual property rights.
We file patent applications to protect innovations arising from our research, development and design. As of December 31, 2024, we owned approximately 95 issued patents and have more than 140 pending patent applications throughout the world. Our patents generally protect certain aspects of our products and related technology. We also own common law and registered trademarks in the U.S. and in certain foreign countries to protect the names of our company, certain products, and key service brands. We own certain copyrights relating to certain aspects of our systems, products and services.
Our success is influenced, in part, by our ability to continue to develop proprietary products and technologies. It is desirable to obtain patent coverage for these products and technologies; however, some are protected as trade secrets. We intend to file trademark and patent applications covering any newly developed products, methods and technologies. However, there can be no guarantee that any of our pending or future filed applications will be issued as patents or registered as trademarks. There can be no guarantee that the various patent and trademark governmental agencies from around the world or some third party will not initiate an interference proceeding involving any of our pending applications or issued patents. Finally, there can be no guarantee that our issued patents or future issued patents, if any, will provide adequate protection from competition.
Patents provide some degree of protection for our proprietary technology. However, the pursuit and assertion of patent rights involve complex legal and factual determinations and, therefore, are characterized by significant uncertainty. In addition, the laws governing patent issuance, and the scope of patent coverage continue to evolve. Moreover, the patent rights we possess or are pursuing generally cover our technologies to varying degrees. As a result, we cannot ensure that patents will issue from any of our patent applications, or that any of the issued patents will offer meaningful protection. In addition, our issued patents may be successfully challenged, invalidated, circumvented, or rendered unenforceable so that our patent rights may not create an effective barrier to competition. We must also pay maintenance fees at set intervals for our patents to not expire prematurely. The laws of some foreign countries may not protect our proprietary rights to the same extent as the laws of the United States. There can be no assurance that any patents issued to us will provide a legal basis for establishing an exclusive market for our products or provide us with any competitive advantages, or that patents of others will not have an adverse effect on our ability to do business or to continue to use our technologies freely. As with all patents, we may be subject to third parties filing claims that our technologies or products infringe on their intellectual property. We cannot predict whether third parties will assert such claims against us or whether those claims will hurt our business. If we are forced to defend against such claims, regardless of their merit, we may face costly litigation and diversion of management’s attention and resources. As a result of any such disputes, we may have to develop, at a substantial cost, non-infringing technology or enter into licensing agreements. These agreements may be unavailable on terms acceptable to such third parties, or at all, which could seriously harm our business or financial condition.
With respect to our trademarks, we file and pursue trademark registrations on words, symbols, logos, and other source identifiers that clients use to associate our products and services with us. Although our registered trademarks carry a presumption of validity, they can be challenged and possibly invalidated and as such, we cannot guarantee that any trademark registration is infallible.
We also rely on trade secret protection of our intellectual property. We attempt to protect trade secrets by entering into confidentiality agreements with employees, consultants and third parties, although, in the past, we have not always obtained such agreements. It is possible that these agreements may be breached, invalidated, or rendered unenforceable, and if so, our trade secrets could be disclosed to our competitors. Despite the measures we have taken to protect our intellectual property, parties to such agreements may breach confidentiality provisions in our contracts or infringe or misappropriate our patents, copyrights, trademarks, trade secrets and other proprietary rights. In addition, third parties may independently discover or invent competitive technologies, or reverse engineer our trade secrets or other technology. Therefore, the measures we are taking to protect our proprietary technology may not be adequate.
10
Cryoport’s Quality Assurance and Regulatory Affairs Programs
Cryoport is committed to quality, and this is reflected in all aspects of our global organization. From our innovative design of products and services to our continuous improvement initiatives, Cryoport has implemented comprehensive quality standards that match or exceed the stringent requirements within the markets we serve. Cryoport’s Quality Management Systems have been designed, implemented, and certified to meet ISO 9001:2015 and ISO 13485 standards in key global locations, demonstrating the discipline necessary to maintain a positive compliance profile. With our strong foundation in ISO 9001:2015 and ISO 13485, we leverage industry-specific experience with applicable regulatory requirements, and industry expectations, to create processes and procedures that incorporate strong operational practices of checks with verification. Our Quality Management Systems are designed to ensure proper controls in manufacturing, temperature-controlled supply chain services, logistics, bioprocessing, customer/client education, contracting, processing, shipping and biostorage, accumulation, and communication.
Our Quality Management Systems incorporate notable good practice quality guidelines and regulations (GxP) elements, beyond those stipulated in ISO 9001:2015 and ISO 13485, to ensure our customers are supported in the manner necessary to maintain standards and to secure a positive compliance profile for Cryoport as a supplier and partner.
Through procedural requirements, Cryoport provides substantial risk-mitigation strategies throughout its full offering of products, systems, and services to support and maintain customer confidence. Metrics and key performance indicators are accumulated regularly, and are trended to predict, and mitigate, potential risks to operations. Operating and senior management utilized this information to enact decisions regarding procedures, processes, resource allocation, and corrective actions. Quality-driven initiatives are supported throughout our global organization. We are also subject to GMED, which is an international reference body in the certification of health care and medical devices quality management systems under ISO 9001, NF EN, and ISO 13485. As such, we are subject to audits by a Medical Device Single Audit Program (MDSAP) auditing organization. Cryoport’s cryogenic biostorage facilities are routinely inspected by the FDA and The Foundation for the Accreditation of Cellular Therapy (FACT) to confirm regulatory compliance to industry requirements related to drug applications, filings, and maintenance of various cryogenically stored materials.
Government Regulation
Globally, Cryoport is subject to regulations in numerous country jurisdictions and international regulations relating to manufacturing, shipments, customs, import, export, safe working conditions, environmental protection, and disposal of hazardous or potentially hazardous substances. In addition, we must ensure compliance with economic sanctions and/or restrictions on individuals, corporations, or countries, and other government regulations affecting trade that may apply to our international cross border business activities.
The shipping of biologic products, biologic commodities, diagnostic specimens, infectious substances, and dangerous goods, whether via air or ground, falls under the jurisdictions of many country, state, federal, local and international agencies. The quality of the packaging that protects such commodities is critical in determining successful shipping conditions and to ensure a commodity will arrive at its destination in a satisfactory condition. Meeting stringent regulations such as Dangerous Goods Regulations, ISTA, and IATA, as applicable, Cryoport has demonstrated compliance and adhesion to these requirements. Many of the regulations for transporting dangerous goods in the United States are determined by international rules formulated under the auspices of the United Nations. Dangerous goods are typically one-time shipments and are not a part of our routine services. When called upon to ship dangerous goods, Cryoport follows strict and stringent guidelines. International Civil Aviation Organization (“ICAO”) is the United Nations organization that develops regulations (Technical Instructions) for the safe transport of dangerous goods by air. If shipment is by air, compliance with the rules established by the IATA is required. IATA is a trade association made up of airlines and air cargo couriers that publishes annual editions of the IATA Dangerous Goods Regulations. These regulations interpret and add to the ICAO Technical Instructions to reflect industry practices. Additionally, the Centers for Disease Control (“CDC”) has regulations (published in the Code of Federal Regulations) for interstate shipping of specimens.
Our Cryoport Express® and ELITE™ Shippers meet Packing Instructions 602 and 650 and are certified for the shipment of Class 6.2 Dangerous Goods per the requirements of the ICAO Technical Instructions for the Safe Transport of Dangerous Goods by Air and IATA. Our present and planned future versions of the Cryoport SmartPak™ Condition Monitoring Systems will likely be subject to regulation by the Federal Aviation Administration (“FAA”), Federal Communications Commission (“FCC”), FDA, IATA and possibly other agencies which may be difficult to determine on a global basis. Additionally, our Chain of Compliance™ processes comply fully with ISO 21973 guidelines.
11
Storage of biological materials that are classified as drug products for human therapeutic use (either for investigational use or commercially approved) or materials used in the manufacture of drug products for human therapeutic use, is regulated by the FDA under Title 21 Code of Federal Regulations (“CFR”) part 210 & 211. Facilities must be compliant with current GMP regulations which are enforced by the FDA through registration and audit. When drug products are exported to other countries, biostorage upon receipt must meet relevant local regulations.
Our MVE Biological Solutions cryogenic stainless-steel freezers and aluminum dewars are certified to the Medical Device Directive (MDD) in the EU. MVE is compliant with current Good Manufacturing Practices (“GMP”) regulations which are enforced by the FDA through registration and audit of compliance with 21 CFR Part 820 and GMP. This FDA registration and product listing is in addition to MVE’s existing ISO 13485 certification.
Additionally, registrations for import are in place for various countries with these requirements.
Cryoport’s advanced integrated temperature-controlled supply chain solutions platform is designed to support the global distribution of high-value commercial biologic and cell-based products and therapies regulated by the United States Food and Drug Administration (FDA), the European Medicines Association (EMA) and other international regulatory bodies. Cryoport’s solutions are also relied upon for the support of pre-clinical, clinical trials, Investigational New Drug Applications (IND), Biologics License Applications (BLA), and New Drug Applications (NDA) with the FDA, as well as global clinical trials initiated in other geographies, where strict regulatory compliance and quality assurance is mandated.
For additional information, see “Part I, Item 1A — Risk Factors—Risks Related to Regulatory and Legal Matters” in this Form 10-K.
Environmental, Social and Governance (“ESG”) Program
Since 2022, our key ESG focus has been on measuring our Greenhouse Gas (GHG) Emissions. GHG emissions represent a clear global significance for companies, consumers, and other stakeholders. Cryoport engages an ESG advisor to assist us in creating an annual report of the previous years’ estimated global GHG emissions. The following summarizes that report.
Summary of our 2023 GHG Emissions Report
Methodology
We used the World Resource Institute’s Greenhouse Gas Protocol - Corporate Accounting and Reporting Standard (Revised Edition) to calculate the company’s GHG emissions. The standard provides accounting tools to measure, manage, and report on GHG emissions. This protocol classifies emissions into three “scopes.” Scope 1 emissions includes direct GHG emissions, which occur from sources that are owned or controlled by a company. Scope 2 emissions include indirect GHG emission from purchased electricity. Scope 3 emissions include all other indirect GHG emissions.
Organizational Boundary
The reporting boundary for the purposes of the report is Cryoport, Inc. and its consolidated subsidiaries, which includes four business units (MVE, Cryoport Systems, CRYOPDP, and Cryogene) and over 50 facility locations across 17 countries (United States, China, Netherlands, Portugal, France, Belgium, United Kingdom, Poland, Germany, Singapore, India, South Korea, Australia, Spain, Ireland, Philippines and Japan) in 2023.
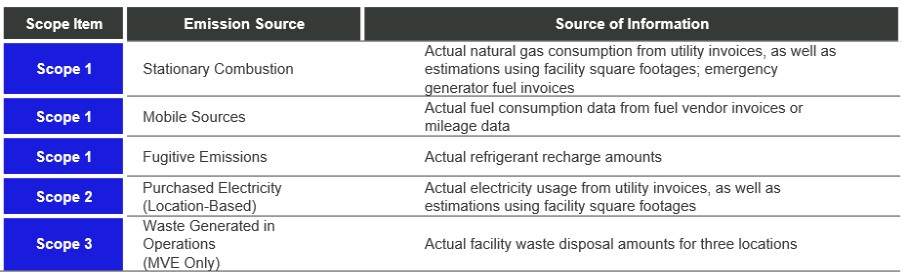
Scope
The scope of the report includes our Scope 1 emissions (Direct) and Scope 2 emissions (Indirect emissions from purchased electricity), but generally excludes Scope 3 emissions (Other indirect emissions). However, we did quantify Scope 3 emissions from waste generated in operations for one business unit because the data was readily available to quantify such emissions. The following sources of emissions were included in the scope of the report for the identified business units:
12
Some of the Scope 3 emissions that contribute to our global carbon footprint, but for which we determined that data was not reasonably available for us to quantify in this report include, but are not limited to, transportation and distribution provided by third parties in the performance of our services; use and end-of-life treatment of sold products; and purchased goods and services.
Assumptions
We used various assumptions to quantify GHG emissions in the report. As with any projections or estimates, actual results or numbers may vary based upon factors such as variations in processes and operations, availability and quality of data, and methodologies used for measurement and estimation. Changes to emission estimates may occur if updated data or emission methodologies become available. The following are some primary assumptions or estimates that we made in the 2023 report:
Stationary Combustion – Natural Gas. Natural gas usage for heating was estimated for several company locations based on spend data and regional utility rates.
Mobile Sources – Vehicle Fuel Consumption. For fleet vehicles where actual fuel usage was not available, vehicle fuel consumption was estimated based on the miles driven and average fuel economy of the vehicle type.
Purchased Electricity (Location-Based). Electricity usage was estimated for several company locations based on either (i) square footage using average intensity for offices, or (ii) spend data and regional utility rates, depending on what information was available.
Utility Estimations. When there were gaps in electricity or natural gas data, the average of the prior and following months data was used to estimate the missing information.
13
Results
Our 2022 and 2023 Total Emissions, as calculated in the 2022 and 2023 reports, are as follows:
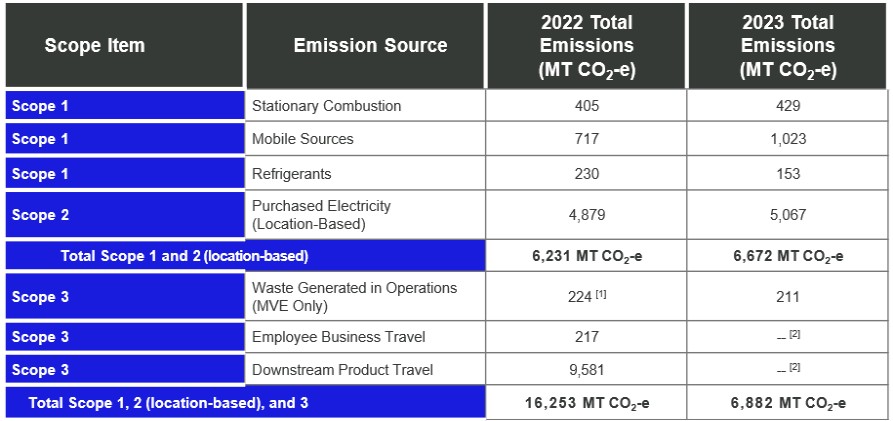
[1] The Total Emissions from Waste Generated in Operations for 2022 also included information for one Cryoport Systems location.
[2] Total Emissions from Employee Business Travel and Downstream Product Travel was not quantified in the 2023 report.
The following charts show the percent of total emissions in 2022 and 2023 that was contributed by each type of emission quantified in the 2022 and 2023 reports:
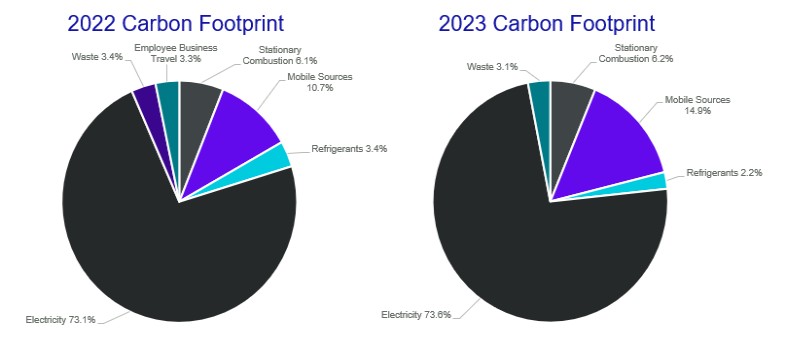
14
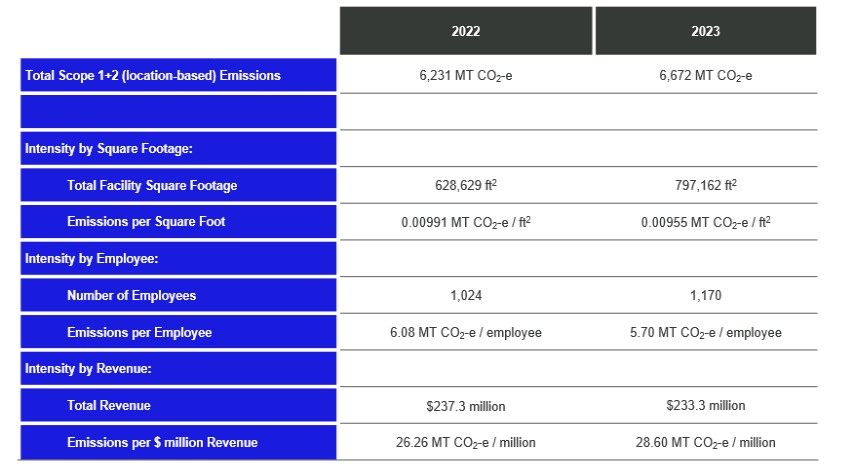
Carbon Footprint Intensities
The following table shows our 2022 and 2023 carbon footprint intensities in relation to square feet of our facilities, revenue, and employees as calculated in our 2022 and 2023 reports.
Next Steps
Cryoport plans to continue to calculate an annual carbon footprint. Conducting an annual carbon footprint allows Cryoport to track changes (i.e., increases or reductions in emissions, fuel usage, or energy usage by facility) and refine our processes and procedures used to estimate our carbon footprint. The Nominations and Governance Committee of the Board of Directors meets annually to review the GHG Emissions Report and will decide, along with Cryoport’s executive team, the next steps that we will take on our ESG journey.
Supporting Our People (December 31, 2024)
| ● | Total Headcount: 1,186 (Full-Time 1,090, Part-Time 15, Contingent 81) |
| ● | Languages Spoken: 22 |
| ● | Countries: 19 |
| ● | Average Years of Service: 5.27 Years |
Cryoport’s global team of employees are our most valuable resource, from our teams on the front line in our global supply chain and logistics centers, to our manufacturing operations, to our business development personnel, to the engineers who design our products and services, to our quality assurance and regulatory teams that assure the safety, quality, compliance, and integrity of our products.
Our success depends on the health, talent, and dedication of our global team. As we grow our team, we strive to retain, develop, and provide advancement opportunities for our employees. We endeavor to make Cryoport a superior growth workplace with a diverse, inclusive, and equitable environment where all team members have the opportunity to flourish.
15
Diversity, Equity & Inclusion (DEI)
We are committed to diversity, equity, and inclusion for our employees across our global Company. Cryoport is an Equal Employment Opportunity employer and currently tracks gender distribution across its operations and management. We maintain clear policies related to anti-harassment, discrimination, and retaliation, and provide an anonymous, third party-managed reporting hotline for employees to report incidents of harassment, discrimination, and policy violations. We provide annual online corporate training programs on harassment, diversity and inclusion, business ethics and code of conduct. In addition, Cryoport’s recruiting process includes targeted outreach to a variety of under-represented constituents.. Cryoport has partnered with or targeted organizations like Hire Heroes, Career OneStop, recruiting at Historical Black Colleges, Accounting and Financial Women’s Alliance, and Women in Technology.
The Human Resources (“HR”) departments in each Cryoport business unit manage HR priorities, including team member career development, engagement, and health and wellness. Our Corporate HR department promotes consistency of policies across our operating companies and manages executive development and employee benefits.
As of December 31, 2024, women represented a total of approximately 35% of all employees, 32% of all managers, 38% of all directors, and 22% of all senior leadership positions (Vice President and above). Cryoport understands that there is work to be done to create a more equitable and representative senior leadership team and continue to push diversity throughout our operations.
We are committed to offering competitive compensation that accounts for geography, industry, experience, and performance. Our compensation programs and practices are designed to attract new employees, motivate, and reward performance, drive growth and support retention. Compensation at Cryoport includes base wages and generally includes incentive opportunities such as restricted stock units, equity stock options, and/or cash bonuses.
Employee Health & Safety
Safety is a priority in every aspect of our business. Across our companies, we are committed to making our workplaces and communities safer for our employees, customers, and the public. Our corporate philosophy is embedded in our day-to-day work through policies and continual education.
Cryoport’s Employee Health & Safety (EHS) programs have demonstrated strong safety performance, as evidenced by our total injury rates (TIR) and lost time injury rates (LTIR) being significantly lower than the global industry averages. Driven by our culture of continuous improvement, we are committed to continue to work toward reducing our TIR and LTIR figures even further.
To understand and improve our safety performance, we measure our operational performance across a variety of indicators—including lost-time-injury rate (LTIR)—on a daily basis. In 2024, our LTIR for our United States operations was 0.46. In addition to looking at past indicators of safety performance, we frequently evaluate the effectiveness of new metrics, including leading indicators, as we strive to improve our safety performance. Cryoport’s operating companies are responsible for implementing policies and procedures aligned with international standards that account for their business and the associated health and safety risks.
Innovating Responsibility
Cryoport recognizes that we play a role in protecting the health and safety of current and future generations through services and solutions that promote sustainability, resilience, and respect for the environment. We strive for a product base that is of the highest quality and with long life spans to minimize impact associated with the production of new products, and Cryoport reviews opportunities to eliminate materials of concern and related managed waste streams.
Product & Service Quality
As a temperature-controlled supply chain provider to the life sciences industry, Cryoport must comply with the safe transportation of regulated hazardous materials. As a result, we have designed and developed several features in its various products to comply with US DOT, IATA, ICAO, and other regulatory and guidance bodies. Additionally, safety warnings are included in our product labeling as well as our manuals. Our products are designed to conform to the following standards (where applicable):
| ● | ISO 13485 (Section 7.3 Design and Development, ISO, QMS) |
| ● | ISO 14971 Application of Risk Management, ISO |
16
| ● | Medical Device Directive Medical Devices Directive 93/42/EEC, and Directive 2007/47/EC amending Council Directive 93/42/EEC concerning medical devices |
| ● | Low Voltage Directive (LVD) (2014/35/EU) |
| ● | Electromagnetic Compatibility Directive (2014/30/EU) |
| ● | RoHS 2 (2011/65/EU) (we are actively working on RoHS 3 and REACH) |
| ● | Safety Requirements For Electrical Equipment For Measurement, Control, And Laboratory Use - Part 1: |
| ● | General Requirements [UL 61010-1:2012 Ed.3+R:29Apr2016] |
| ● | Safety Requirements For Electrical Equipment For Measurement, Control, And Laboratory Use – Part 1: |
| ● | General Requirements (R2017) [CSA C22.2#61010-1-12:2012 Ed.3+U1; U2] |
| ● | IEC 60601-1 - Medical electrical equipment - Part 1: General requirements for basic safety and essential performance |
| ● | IEC 61326-1:2012 - Electrical Equipment For Measurement, Control And Laboratory Use - EMC Requirements - Part 1: General Requirements |
| ● | ASME SEC. VIII Pressure Vessel Code (Fusion Only) |
| ● | EU Pressure Equipment Directive (EU97/23/EC) (Fusion Only) |
| ● | FCC 47 CFR Class B Verification (Fusion Only) |
| ● | IEC 62304 Medical device software — Software life cycle processes |
These standards are integrated into our development methodology used to design new products and services within our company. The development process includes a risk management assessment done in accordance with ISO 14971 that identifies hazards and mitigates risks via design improvements, process improvements, and warnings (including labels and safety information shipped with the product).
We pride ourselves on our exceptional operational quality. In 2024, we estimate that our temperature-controlled supply chain solutions focused on cell and gene therapies had a 99.97% delivery success rate and due to this performance we estimate that 25,968 additional patients were able to receive therapies over the past 24 months. In 2024, we estimate that our CryoStork® solution had a 99.88% delivery success rate and due to this performance we estimate that 1,936 intended parents are potentially able to have successful cycles resulting in the birth of a child on an annual basis because of our CryoStork® solution.
While rare, recalls of products may become necessary. The primary responsibility for recall management lies with our Vice President of Quality Assurance and Regulatory Affairs for manufacturing. The executive team is involved in the decision and implementation processes depending upon the specifics of any recall that may be required. Customer service personnel, sales staff and other resources would then be utilized to reach all distributors and direct end users. The results of recalls are evaluated daily until the recall is closed. There were no product recalls during 2024.
Product Lifecycle Management
Cryoport’s unique products are developed with long-term use in mind. Cryoport’s products are primarily constructed of recyclable aluminum or stainless steel, and we approach the extension of product lifecycles through the following four areas:
| ● | Longevity |
| ● | Reparability |
| ● | Reusability |
| ● | Recyclability |
We strive for a product base with long life spans to minimize the impact associated with production of a new product. At our MVE Biological Solutions production facility, in 2024, we manufactured cryogenic freezer units that we estimate utilize approximately 1/1865 of the energy used by conventional mechanical freezers used for similar applications. For example, our freezer production displaced annual electricity consumption by 196,705,031 kWh from what would otherwise be consumed from alternative products. This amount of electricity could power 19,172 homes annually. This reduction in energy consumption from our freezer lines alone equates to 152,504,879 pounds of GHG emissions avoided or the emissions equivalent to 16,135 passenger vehicles driven for one year.
Cryoport regularly reviews opportunities to eliminate the use of materials considered hazardous and related managed waste streams. Cryoport does not utilize any substances of concern in our products; we do currently utilize minimal quantities of hazardous materials that are not listed as substances of concern in our operations, primarily in the form of isopropanol, epoxies, butyl cellosolve,
17
lacquer thinner, paint, hyamine and isopropyl alcohol. These materials and the insignificant quantities of hazardous wastes generated by our production facilities are managed in compliance with all state and federal regulations. Any hazardous waste that is generated is tracked and managed with an overall goal of eliminating hazardous materials where possible. Cryoport strives to have a conflict-free supply chain and is committed to working with its suppliers to increase transparency regarding the origin of minerals contained in its products, including minerals identified as conflict minerals (tin, tungsten, tantalum, and gold), and has adopted a Conflict Minerals Policy, which is available on our website at www.cryoportinc.com on the “Investor Relations: Governance” page under the heading “Governance Documents.”
Governing Ethically
Cryoport recognizes that solid supplier relationships are essential to our ability to meet customer requirements for quality solutions. We expect our business partners to share our commitment to ethics, integrity, regulatory compliance, safety, human rights, data security, and environmental protection. By the same token, as a provider accountable to thousands of companies worldwide, we pledge, through our ESG performance, to meet or exceed our clients’ requirements for the same.
Business Ethics
We are committed to operating with honesty and transparency in accordance with the highest ethical and corporate governance standards – mutual respect, integrity and trust are the foundation of our company. Our Code of Ethical Business Conduct (the “Code of Ethics”) serves as the foundation of our corporate integrity and compliance program and applies to our directors and all employees, including our Chief Executive Officer and Chief Financial Officer. The Code of Ethics is available on our website at www.cryoportinc.com on the “Investor Relations: Governance” page under the heading “Governance Documents.” All employees across our operations are provided with training and reference materials to reinforce this commitment to integrity and ethics in our business. Our Code of Ethics is is translated into local languages for our employees where applicable and includes guidance on topics including, but not limited to the following:
| ● | Corruption |
| ● | Anti-Trust and Anti-Competitive Behavior |
| ● | Insider Dealings |
| ● | Gifts |
| ● | Bribes (e.g., explicit prohibition of facilitation payments) |
| ● | Conflicts of Interest |
| ● | Intellectual Property |
| ● | Regulatory Compliance |
| ● | Truthful and Accurate Reporting |
| ● | Human Rights |
| ● | Equal Employment Opportunity |
| ● | Anti-harassment |
| ● | Environmental Compliance and Sustainability |
| ● | Whistleblower protections (including non-retaliation) |
| ● | Political Activity and Contributions (e.g., explicit prohibition of contribution of any kind to any candidate or political party without express prior approval of our board of directors – this covers both direct contributions and indirection support; no political contributions have been made in recent years) |
| ● | Reporting Violations of Company Policy |
Our officers, directors, and managers are responsible for promoting the principles within the Code of Ethics and fostering a culture of ethical conduct. Our commitment to doing the right thing depends on our employees’ being comfortable in reporting any suspected violations of law or unethical conduct, and our leaders’ abilities to address suspected violations promptly, with respect. Our global policy against retaliation encourages employees to come forward to report concerns in good faith. When a matter is reported to a manager or our HR department, the concern is reviewed to determine whether it should be escalated to the legal department. The legal department also has criteria for further escalation, if necessary, to legal department management. Every new employee is introduced to the Code of Ethics through training and orientation.
18
We develop and update these policies when we identify a need for employee clarification, the emergence of new laws or regulations, or other external factors. We routinely review and update the language in our policies, and how we present information, to ensure our employees understand the risks they face in their jobs, and steps they can take to mitigate those risks and report potential problems.
Our commitment to human rights is an important part of the Code of Ethics. We are committed to protecting and advancing human rights in our operations around the world. We pay fair wages and comply with wage laws in all the countries where we operate. We prohibit the use of child, compulsory, or forced labor, and we share the zero-tolerance policies adopted by the United States and other governments against slavery and human trafficking. We prohibit the trafficking of persons for any purpose and trafficking-related activities, and we expect the same from our suppliers and vendors.
In addition to our Code of Conduct, our senior leadership team actively oversees the governance of our ethics programs to help ensure that commitment is driven from the top down, and that program owners are accountable for successful program compliance.
Cryoport does not conduct clinical trials, animal testing or use human tissue of any kind in the manufacture or design of our products, and our Code of Conduct governs the ethical behavior of our employees across all of Cryoport’s global operations. Further, we do not conduct lobbying activities.
Supplier Management
Temperature-controlled supply chain support to the life sciences industry is critical to all that Cryoport does; therefore, we take an active approach to managing suppliers and partners to ensure that appropriate compliance, health, safety, labor practices, and ethical standards are employed. Our internal diligence process for third-party vendors includes a supplier questionnaire that is required for vendor approval and a regular auditing process thereafter for existing suppliers. The questionnaire is intended to verify that our suppliers have programs in place to manage material risk areas associated with the given supplier’s operations and particular consideration is paid to bribery or other forms of corrupt activity. Suppliers are not approved until this mandatory due diligence is complete and a completed assessment form is on file.
As an example, if one of our transportation suppliers employs or works with a Dangerous Goods Safety Advisor, we confirm the presence of a credentialed role responsible for overseeing activities associated with dangerous goods, including but not limited to, employee training and coaching, reporting, and monitoring of activities associated with the transportation of dangerous goods. The purpose of this inquiry is to gauge the degree of oversight over dangerous goods management by our suppliers to help ensure product and employee welfare.
Our Code of Conduct extends throughout our approved suppliers and thus sets an expectation for our suppliers to commit to operating with honesty, truthfulness and transparency in accordance to the highest ethical and corporate governance standards, as Cryoport personifies through our operations. Per our Code of Conduct, Cryoport will not tolerate the use by suppliers of forced labor in any form.
Data Privacy & Security
Cryoport uses an outside Center for Internet Security (CIS) assessment firm to evaluate our data security controls in an effort to protect our businesses and secure the information of our employees and customers. The CIS evaluation process utilizes the CIS’ Critical Security Controls Capability Maturity Model Integration (CMMI) methodology, and is an ongoing initiative used to continuously improve the CMMI rating for the Company.
Our customers rely on Cryoport to securely and reliably deliver temperature-controlled supply chain solutions globally, including providing a secure online portal for order entry, tracking, condition monitoring, and for the retrieval of historic information. Protecting the privacy of our customers and suppliers is essential to maintaining their trust, and we take a proactive approach to safeguard all data and ensure a secure environment. With the increasing presence and sophistication of online threats, we strive for continuous improvements that aim to protect our business and our customers. We regularly review our technology, policies, and practices to maintain compliance with all relevant global regulations. We do not sell customers’ data to third parties. Additionally, Cryoport employees with a computer are required to complete a annual online training courses on information security and data privacy. The courses addresses a range of topics related to information security and data privacy, including awareness regarding social engineering and cybercrimes, protecting the workplace, and protecting data.
19
Cryoport Societal and Environmental Impact Statements
Examples of some of our positive societal and environmental impacts for 2023 and 2024 include the following:
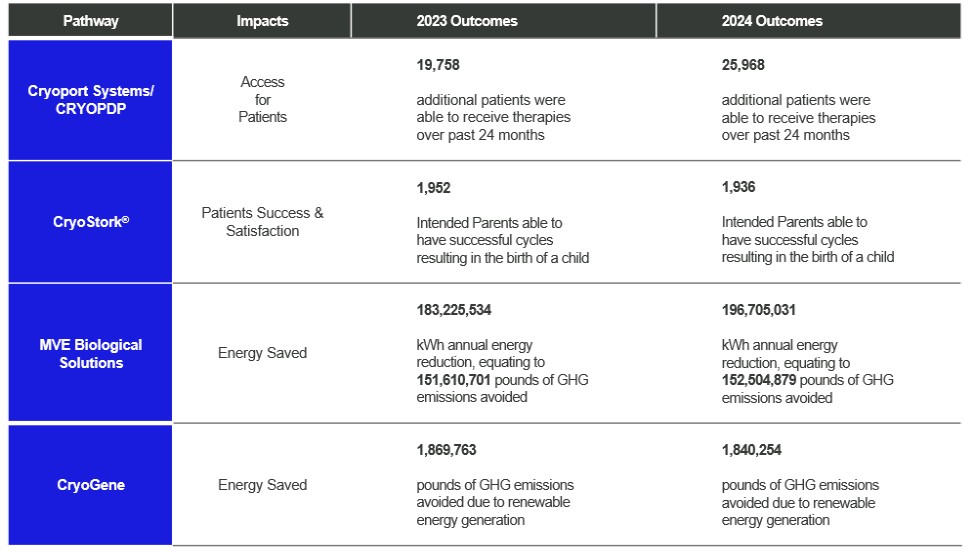
Our positive impacts for 2023 and 2024 were based on the following:
Access to Patients. Our calculation of the number of additional patients that were able to receive therapies was based our success rate for shipments, which is higher than the average success rate in the cold chain markets of 80%, pursuant to Rodrigue, J-P (2020), The Geography of Transport Systems, Fifth Edition, New York: Routledge.
Patient Success & Satisfaction. Our calculation of the number of intended parents able to have successful cycles resulting the birth of a child is based on the weighted average chance of a live singleton birth per intended egg retrieval across women of all ages of 27.23% as reported in the 2020 Society for Assisted Reproductive Technology (SART) Clinic Summary Report (CSR).
Energy Saved – MVE Biological Solutions. Our calculation of energy reduction is based on the reduced energy consumption from MVE freezer use compared to the average energy consumed by operation of mechanical freezers, which we assumed to be 31.7 kWh/day based on product specifications from a mechanical freezer manufacturer.
Energy Saved – CRYOGENE. Our calculation of GHG emissions avoided is based on the output mission rates for GHG emissions from the EPA eGRID data (2023) for the Electric Reliability Council of Texas (ERCOT).
Employees
We refer to our employees as our “team.” They are critical to our success, and we are in constant communication and training. We believe that we have assembled a strong management and leadership team with the experience and expertise needed to execute our business strategy. As of December 31, 2024, we had 1,186 employees: 1,090 full-time, 15 part-time, and 81 temporary, of which 489 are located in the Americas, 333 in EMEA and 364 in APAC. This increase of over 16 employees compared to December 31, 2023 is, primarily as a result of the further build out of our global organization, both organically and through acquisitions, to support our expanded
20
solutions offering and the expected growth in the markets we serve. We anticipate hiring additional personnel as required to support our global growth strategy.
Corporate History and Structure
We are a Nevada corporation originally incorporated under the name G.T.5-Limited (“GT5”) on May 25, 1990. In connection with a Share Exchange Agreement in March 2005, we changed our name to Cryoport, Inc. and acquired all of the issued and outstanding shares of common stock of Cryoport Systems, Inc., a California corporation. Cryoport Systems, Inc., which was originally formed in 1999 as a California limited liability company, was reorganized into a California corporation on December 11, 2000 and converted into Cryoport Systems, LLC, a California limited liability company, on September 17, 2020, and remains one of our operating companies under Cryoport, Inc. Our principal executive offices are located at 112 Westwood Place, Suite 350, Brentwood, TN 37027. The telephone number of our principal executive office is (949) 470-2300, and our main corporate website is www.cryoportinc.com. The information on or that can be accessed through our website is not part of this Form 10-K.
Information about our Executive Officers
The following are our executive officers as of the filing date of this Form 10-K:
Jerrell W. Shelton. Mr. Shelton became a member of our board of directors in October 2012 and was appointed President and Chief Executive Officer of the Company in November 2012. He was appointed Chairman of the Board in October 2015. He served on the Board of Directors and standing committees of Solera Holdings, Inc. from April 2007 through November 2011. From June 2004 to May 2006, Mr. Shelton was the Chairman and CEO of Wellness, Inc., a provider of advanced, integrated hospital and clinical environments. Prior to that, he served as Visiting Executive to IBM Research and Head of IBM’s WebFountain. From October 1998 to October 1999, Mr. Shelton was Chairman, President and CEO of NDC Holdings II, Inc. Between October 1996 and July 1998, he was President and CEO of Continental Graphics Holdings, Inc. From October 1991 to July 1996, Mr. Shelton served as President and CEO of Thomson Business Information Group. Mr. Shelton has a B.S. in Business Administration from the University of Tennessee and an M.B.A. from Harvard University. Mr. Shelton’s extensive leadership, management, strategic planning and financial expertise through his various leadership and directorship roles in public, private and global companies, makes him well-qualified to serve as a member of the board of directors.
Robert S. Stefanovich. Mr. Stefanovich became Chief Financial Officer and Treasurer for the Company in June 2011. In 2019, he was also given the title Senior Vice President. From 2011 to 2019, Mr. Stefanovich served as the Secretary of the Company. From June 15, 2012 to November 4, 2012, Mr. Stefanovich served as the Principal Executive Officer of the Company. From November 2007 through March 2011, Mr. Stefanovich served as Chief Financial Officer of Novalar Pharmaceuticals, Inc., a venture-backed specialty pharmaceutical company. Prior to that, he held several senior leadership positions, including interim Chief Financial Officer of Xcorporeal, Inc., a publicly traded medical device company, Executive Vice President and Chief Financial Officer of Artemis International Solutions Corporation, a publicly traded software company, Chief Financial Officer and Secretary of Aethlon Medical Inc., a publicly traded medical device company and Vice President of Administration at SAIC, a Fortune 500 company. Mr. Stefanovich also served as a member of the Software Advisory Group and an Audit Manager with Price Waterhouse LLP’s (now PricewaterhouseCoopers) hi-tech practice in San Jose, California and Frankfurt, Germany. He received his Master of Business Administration and Engineering from University of Darmstadt, Germany.
Mark Sawicki, Ph.D. Dr. Sawicki became President and Chief Executive Officer of Cryoport Systems, LLC, a wholly-owned subsidiary of the Company, and the Senior Vice President and Chief Scientific Officer of the Company in September 2020 and served as the Chief Commercial Officer of Cryoport Systems from January 2015 to August 2020. Dr. Sawicki brings over 20 years of business development and sales management experience, having consistently delivered on corporate revenue and market share goals in the pharmaceutical and biotechnology industries. Dr. Sawicki previously served as the Chief Business Officer at AAIPharma Services Corporation/Cambridge Major Laboratories Inc. (now Alcami Corporation), a contract development, testing, and manufacturing organization for pharma and biotech companies. Additionally, he has served in senior business development roles at CMC Biologics, a provider of biopharmaceutical contract manufacturing services, and Albany Molecular Research Inc. (AMRI), a contract research and manufacturing organization. Dr. Sawicki holds a bachelor’s in biochemistry from the State University of New York at Buffalo and a Ph.D. in biochemistry from the State University of New York at Buffalo, School of Medicine and Biomedical Sciences. He also received graduate training at the Hauptman Woodard Medical Research Institute. Dr. Sawicki has authored a dozen scientific publications in drug discovery with a focus on oncology and immunology.
21
Available Information
Our main corporate website address is www.cryoportinc.com. The information on or that can be accessed through our website is not part of this Form 10-K. We electronically file with the SEC our Annual Report on Form 10‑K, Quarterly Reports on Form 10‑Q, Current Reports on Form 8‑K and amendments to the reports filed or furnished pursuant to Section 13(a) or 15(d) of the Exchange Act. We make available free of charge on or through our website copies of these reports as soon as reasonably practicable after we electronically file these reports with, or furnish them to, the SEC. The SEC also maintains an internet site that contains reports, proxy and information statements and other information regarding issuers that file electronically with the SEC at www.sec.gov.
ITEM 1A. RISK FACTORS
The following risk factors could materially and adversely affect our business, financial condition and results of operations. These risk factors do not identify all of the risks that we face.
Risks Related to Our Business
As an increasingly global business, we are exposed to economic, political, and other risks in different countries which could materially reduce our sales, profitability or cash flows, or materially increase our liabilities.
Since we manufacture and sell our products worldwide, our business is subject to risks associated with doing business internationally. Our future results could be harmed by a variety of factors, including:
| ● | changes in foreign currency exchange rates, exchange controls and currency restrictions; |
| ● | changes in a specific country’s or region’s political, social or economic conditions; |
| ● | political, economic and social instability, including acts of war; |
| ● | outbreak of disease or illness in any of the countries in which we sell our products or in which we or our suppliers operate; |
| ● | tariffs, other trade protection measures, and import or export licensing requirements, including as a result of the recent changes in the presidential administration and/or the make-up of the Senate and the House of Representatives; |
| ● | potentially negative consequences from changes in U.S. and international tax laws; |
| ● | difficulty in staffing and managing geographically widespread operations; |
| ● | changes in customer spending due to the increased economic uncertainties and the disruption in the capital markets; |
| ● | requirements relating to withholding taxes on remittances and other payments by subsidiaries; |
| ● | restrictions on our ability to own or operate subsidiaries, make investments or acquire new businesses in these jurisdictions; |
| ● | restrictions on our ability to repatriate dividends from our foreign subsidiaries; |
| ● | difficulty in collecting international accounts receivable; |
| ● | difficulty in enforcement of contractual obligations under non-U.S. law; |
| ● | transportation delays or interruptions; and |
| ● | changes in regulatory requirements including as it relates to protection of our intellectual property. |
The functional currency for most of our foreign operations is the applicable local currency. As a result, fluctuations in foreign currency exchange rates affect the results of our operations and the value of our foreign assets and liabilities, which in turn may adversely affect results of operations and cash flows and the comparability of period-to-period results of operations. Changes in foreign currency exchange rates may also affect the relative prices at which we and foreign competitors sell products in the same market. Foreign governmental policies and actions regarding currency valuation could result in actions by the United States and other countries to offset the effects of such fluctuations. Given the unpredictability and volatility of foreign currency exchange rates, ongoing or unusual volatility may adversely impact our business and financial conditions.
We depend on the availability of certain component products used in our solutions; delays or increased costs in the procurement of components manufactured by third parties could adversely affect our business operations, financial performance and results of operations, and we may experience customer dissatisfaction and harm to our reputation.
If we fail to procure sufficient components used in our products from our third-party manufacturers, we may be unable to deliver our solutions to our customers on a timely basis, which could lead to customer dissatisfaction and could harm our reputation and ability to compete. We currently acquire various component parts for our solutions from various independent manufacturers, some of
22
which are sole sourced. We would likely experience significant delays or cessation in producing some of these components if a labor strike, natural disaster, public health crisis, act of war or other supply disruption were to occur. If we are unable to procure a component from one of our manufacturers, we may be required to enter into arrangements with one or more alternative manufacturing companies, which may cause delays in producing components or result in significant increase in costs. To date, we have not experienced any material delay that has adversely impacted our operations, but this does not mean that we will continue to have timely access to adequate supplies of essential materials and components in the future or that supplies of these materials and components will be available on satisfactory terms when needed. If our vendors for these materials and components are unable to meet our requirements, fail to make shipments in a timely manner, or ship defective materials or components, we could experience a shortage or delay in supply or fail to meet our contractual requirements, which would adversely affect our results of operations and negatively impact our cash flow and profitability. Continued delay in our ability to produce and deliver our products and services could also cause our customers to purchase alternative products and services from our competitors and/or harm our reputation.
Our products and services may contain errors or defects, which could result in damage to our reputation, lost revenues, diverted development resources and increased service costs, litigation and product recalls. These risks may be heightened when our products or services are used in connection with human reproductive medicine.
Our products and services must meet stringent requirements and we must develop our products and services solutions quickly to keep pace with the rapidly changing market. Products and services as sophisticated as ours could contain undetected errors or defects, especially when first introduced or when new equipment or versions of our software are released. If our products and services are not free from errors or defects, we may incur an injury to our reputation, lost revenues, diverted development resources, increased customer service and support costs, product recalls and litigation. The costs incurred in correcting any product errors or defects may be substantial and could adversely affect our business, results of operations and financial condition.
Due to the low temperatures at which some of our products are used and the fact that some of our products are relied upon by our customers or end users in their facilities or operations or are manufactured for relatively broad medical, transportation, or consumer use, we face an inherent risk of exposure to claims in the event that the failure, use, or misuse of our products results, or is alleged to result, in death, bodily injury, property or sample damage, or economic loss. The amount of damages for which we are potentially held liable for may be higher when our products or services are used in connection with human reproductive medicine than when they are used for other purposes. For example, in some states, damage to an embryo may be deemed wrongful death for which punitive or other damages may be awarded, which would not otherwise be available. In addition, we specialize in the secure storage of biological specimens, materials and samples covering the full range of temperatures from cryogenic through controlled room temperature. Any damage to these specimens, materials and samples may be attributed to a failure of our storage systems or services, which could lead to claims for damages made by customers and could also harm our relationship with customers and damage our reputation in the life sciences industry, resulting in material harm to our business.
Although we currently maintain product liability coverage, which we believe is adequate for product liability claims and for the continued operation of our business, it includes customary exclusions and conditions, may not cover certain specialized applications and generally does not cover warranty claims. Additionally, such insurance may become difficult to obtain or be unobtainable in the future on terms acceptable to us. A successful product liability claim or series of claims against us, including one or more consumer claims purporting to constitute class actions or claims resulting from extraordinary loss events, in excess of or outside our insurance coverage, or a significant warranty claim or series of claims against us, could materially decrease our liquidity, impair our financial condition, and adversely affect our results of operations. See “—Risks Related to Our Business—Our products and services may expose us to liability in excess of our current insurance coverage” for additional information.
In addition, regardless of merit or eventual outcome, product liability claims may result in, among other things, costs of litigation, distraction of management’s attention from our primary business, the inability to commercialize our existing or new products, decreased demand for our products or, if cleared or approved, products in development, damage to our business reputation, product recalls or withdrawals from the market, withdrawal of clinical trial participants, substantial monetary awards to patients or other claimants, or loss of revenue.
While we may attempt to manage our product liability exposure by proactively recalling or withdrawing from the market any defective products, any recall or market withdrawal of our products may delay the supply of those products to our customers and may impact our reputation. We can provide no assurance that we will be successful in initiating appropriate market recall or market withdrawal efforts that may be required in the future or that these efforts will have the intended effect of preventing product malfunctions and the accompanying product liability that may result. Additionally, any recall could result in significant costs to us and significant
23
adverse publicity, which could harm our ability to market our products in the future. Such recalls and withdrawals may also be used by our competitors to harm our reputation for safety or be perceived by customers as a safety risk when considering the use of our products. Though it may not be possible to quantify the economic impact of a recall, it could have a material adverse effect on our business, financial condition and results of operations.
Additionally, for some of our products we offer a limited warranty for product returns which are due to defects in quality and workmanship. We estimate our potential liability for future product returns and establish reserves on our financial statements in amounts that we believe will be sufficient to address our warranty obligations; however, our actual liability for product returns may significantly exceed the amount of our reserves. If we underestimate our potential liability for future product returns, or if unanticipated events result in returns that exceed our historical experience, our financial condition and operating results could be materially and adversely affected.
Our business operations, financial performance and results of operations have been adversely affected and could in the future be materially adversely affected by the pandemics, epidemics or other public health crises, such as COVID-19.
The occurrence of pandemics, epidemics or other public health crises could materially affect our business, financial condition, results of operations and cash flows, including due to negative impacts to the global economy, disruptions to global supply chains and workforce participation, and volatility and disruption of financial markets. For example, since COVID-19’s initial outbreak, governments and businesses took unprecedented measures in response, including restrictions on travel and business operations, temporary closures of businesses, and quarantine and shelter-in-place orders. Such response significantly curtailed global economic activity and caused significant volatility and disruption in global financial markets. The COVID-19 pandemic and the measures taken by many countries in response have adversely affected and could in the future materially adversely impact our business operations, financial performance and results of operations. During the course of the pandemic, certain of our facilities have experienced disruptions, such as our MVE Biological Solutions manufacturing facility in Chengdu, China that was temporarily impacted by COVID-19 lockdowns in China during the third quarter of 2022, and similar disruptions could occur in the future.
The extent to which pandemics, epidemics or other public health crises may impact our business operations, financial performance and results of operations is uncertain and will depend on many factors outside our control, including the timing, extent, trajectory and duration of the pandemic, epidedemic or other public health crises, the emergence of new variants, the development, availability, distribution and effectiveness of vaccines and treatments, and the imposition of protective public safety measures. Other potential impacts on us resulting from pandemics, epidemics or other public health crises may include, but not limited to, material adverse effects on our manufacturing, supply chain and distribution channels, our ability to execute our strategic plans, and our profitability. The potential effects of pandemics, epidemics or other public health crises may also impact and potentially heighten many of our other risk factors discussed in this “Risk Factors” section.
We will have difficulty increasing our revenues if we experience delays, difficulties or unanticipated costs in establishing the sales, marketing and distribution capabilities necessary to successfully commercialize our solutions.
We plan to further enhance our sales, marketing and distribution capabilities in the Americas, EMEA, and APAC. It will be expensive and time-consuming for us to develop and integrate our global marketing and sales network and thus we intend to further broaden our strategic alliances with domestic and international providers of shipping services and other solutions providers to the life sciences industry to incorporate use of our platform of solutions in their service offerings. We may not be able to provide adequate incentive to our sales force or to establish and maintain favorable distribution and marketing collaborations with others to promote our solutions. In addition, any third party with whom we have established a marketing and distribution relationship may not devote sufficient time to the marketing and sales of our solutions, thereby exposing us to potential expenses in exiting such distribution agreements. We, and any of our alliance partners, must also market our services in compliance with federal, state, local and international laws relating to the provision of incentives and inducements. Violation of these laws can result in substantial penalties. Therefore, if we are unable to successfully motivate and expand our marketing and sales force and further develop our sales and marketing capabilities, or if our alliance partners fail to promote our solutions, we will have difficulty increasing our revenues and the revenue may not offset the additional expense of expansion.
We expect to base our equipment and inventory purchasing decisions on our forecasts of customers’ demand, and if our forecasts are inaccurate, our operating results could be materially harmed.
As our customer base increases, we expect the need to purchase additional equipment and inventory. Our forecasts will be based on multiple assumptions, each of which may cause our estimates to be inaccurate, affecting our ability to provide products to our
24
customers. When demand for our products increases significantly, we may not be able to meet demand on a timely basis, and we may need to expend a significant amount of time working with our customers to allocate limited supply and maintain positive customer relations, or we may incur additional costs in order to rush the manufacture and delivery of additional products. If we underestimate customers’ demand, we may forego revenue opportunities, lose market share and damage our customer relationships. Conversely, if we overestimate customer demand, we may purchase more equipment and inventory than we are able to use or sell at any given time or at all. As a result of our failure to properly estimate demand for our products, we could have excess or obsolete equipment and/or inventory, resulting in a decline in the value of our equipment and/or inventory, which would increase our costs of revenues and reduce our liquidity. Our failure to accurately manage our equipment purchases and inventory relative to demand would adversely affect our operating results.
If we suffer a disruption or loss to our factories, facilities or distribution system due to factors outside of our control, our operations could be seriously harmed.
We rely on our distribution system including third-party shipment and carrier services to transport our shippers containing biological material. These third-party operations could be subject to natural disasters, adverse weather conditions, other business disruptions, and carrier error, which could cause delays in the delivery of our shippers, which in turn could cause serious harm to the biological material being shipped. As a result, any prolonged delay in shipment, whether due to technical difficulties, power failures, break-ins, destruction or damage to carrier facilities as a result of a natural disaster, fire, or any other reason, could result in damage to the contents of the shipper.
Additionally, our factories and facilities may be subject to catastrophic loss due to fire, flood, terrorism, increasing severity or frequency of extreme weather events, or other natural or man-made disasters, as well as disruptions due to a widespread outbreak of an illness or any other public health crisis, such as the COVID-19 pandemic. In particular, certain components of our key products are manufactured in China, which may be more likely than other locations to have disruptions caused by the response to a public health crisis, such as COVID-19. For example, our MVE Biological Solutions manufacturing facility in Chengdu, China was temporarily impacted by COVID-19 lockdowns in China during the third quarter of 2022, and similar disruptions could occur in the future.
Further, we operate facilities that specialize in the secure storage of biological specimens, materials and samples. If natural disasters or similar events, like hurricanes, fires or explosions or large-scale accidents or power outages, were to occur that prevented us from using all or a significant portion of these facilities, damaged critical infrastructure or our customers’ biological samples, or otherwise disrupted operations at such facilities, this could affect our ability to maintain ongoing operations and cause us to incur significant expenses. Insurance coverage may not be adequate to fully cover losses in any particular case.
For example, in January 2022, a fire occurred at the MVE Biological Solutions manufacturing facility located in New Prague, Minnesota, which manufactures aluminum dewars and is one of MVE Biological Solutions’ three global manufacturing facilities. As a consequence of the fire damage, the New Prague manufacturing operations were curtailed on an interim basis until the necessary repairs were completed, which adversely impacted our revenue in the first quarter of 2022. See “Management’s Discussion and Analysis of Financial Condition and Results of Operations—MVE Biological Solutions Fire” for additional information.
Our products and services may expose us to liability in excess of our current insurance coverage.
Our platform of products and services involve significant risks of liability, which may substantially exceed the revenues we derive from them. We cannot predict the magnitude of these potential liabilities. We currently maintain general liability insurance and product liability insurance. Claims may be made against us that exceed the limits of these policies.
Our liability policy is an “occurrence” based policy. Thus, our policy is complete when we purchased it and following cancellation of the policy it continues to provide coverage for future claims based on conduct that took place during the policy term. Our insurance coverage, however, may not protect us against all liability because our policies typically have various exceptions to the claims covered and also require us to assume some costs of the claim even though a portion of the claim may be covered. In addition, if we expand into new markets, we may not be aware of the need for, or be able to obtain insurance coverage for such activities or, if insurance is obtained, the dollar amount of any liabilities incurred could exceed our insurance coverage. A partially or completely uninsured claim, if successful and of significant magnitude, could have a material adverse effect on our business, financial condition and results of operations.
25
If we use biological and hazardous materials in a manner that causes injury, we could be liable for damages.
Our customers may ship potentially harmful biological materials in our dewars. We cannot eliminate the risk of accidental contamination or injury to employees or third parties from the use, storage, handling or disposal of these materials. In the event of contamination or injury, we could be held liable for any resulting damages, and any liability could exceed our resources or any applicable insurance coverage we may have. Additionally, we are subject to, on an ongoing basis, federal, state and local laws and regulations governing the use, storage, handling and disposal of these materials and specified waste products. In the event of an accident, we could be held liable for damages.
We operate in a competitive industry and if we cannot compete effectively, we will lose business.
We expect to continue to experience significant and increasing levels of competition in the future. While there are technological and marketing barriers to entry, we cannot guarantee that these barriers will be sufficient to defend our market share against current and future competitors. Our principal competitive considerations in our market include:
| ● | financial resources to allocate to proper marketing and an appropriate sales effort; |
| ● | acceptance of our solutions model; |
| ● | acceptance of our solutions including per use fee structures and other charges for services; |
| ● | keeping up technologically with ongoing development of enhanced features and benefits; |
| ● | the ability to develop and maintain and expand strategic alliances; |
| ● | establishing our brand name; |
| ● | our ability to deliver our solutions to our customers when requested; and |
| ● | our timing of introductions of new solutions and services. |
Our future revenue stream depends to a large degree on our ability to bring new solutions and services to market on a timely basis. We generally sell our products in industries that are characterized by increased competition through frequent innovation, rapid technological changes and changing industry standards. Without the timely introduction of new products, services and enhancements, our products and services may become obsolete over time, in which case our revenue and operating results could suffer.
There may also be other companies which are currently developing competitive products and services or which may in the future develop technologies and products that are comparable, superior or less costly than our own. For example, some specialty couriers and packaging manufacturers with greater resources currently provide temperature-controlled packaging solutions and may develop other products or solutions in the future, both of which compete with our products. A competitor that has greater resources than us may be able to develop and expand their networks and product offerings more quickly, devote greater resources to the marketing and sale of their solutions and adopt more aggressive pricing policies. We may not be able to successfully compete with a competitor that has greater resources, which may adversely affect our business.
If we successfully develop products and/or services, but those products and/or services do not achieve and maintain market acceptance, our business will not be profitable.
The degree of acceptance of our platform of existing products and services or any future products or services by our current target markets, and any other markets to which we attempt to sell our products and services, as well as our profitability and growth, will depend on a number of factors including, among others, our shippers’ ability to perform and preserve the integrity of the materials shipped, relative convenience and ease of use of our shippers and/or Cryoportal®, reliability and effectiveness of our biostorage services, availability of alternative products or new technologies that make our solutions and services less desirable or competitive, pricing and cost effectiveness, effectiveness of our or our collaborators’ sales and marketing strategy and the adoption cycles of our targeted customers.
In addition, even if our products and services achieve market acceptance, we may not be able to maintain that market acceptance over time if new products or services are introduced that are more favorably received than our products and services, are more cost effective, or render our products obsolete. Further, there can be no assurance that future developments in technology will not make our technology non-competitive or obsolete, or significantly reduce our operating margins or the demand for our offerings, or otherwise negatively impact our ability to be profitable.
26
The integration and operation of acquired businesses may disrupt our business and create additional expenses, and we may not achieve the anticipated benefits of the acquisitions.
Integration of an acquired business involves numerous risks, including assimilation of operations of the acquired business and difficulties in the convergence of systems and processes, the diversion of management’s attention from other business concerns, risks of entering markets in which we have had no or only limited direct experience, assumption of unknown or unquantifiable liabilities, difficulties in completing strategic initiatives already underway in the acquired company, and unfamiliarity with partners of the acquired company, each of which could have a material adverse effect on our business, results of operations and financial condition. We cannot assure that these risks or other unforeseen factors will not offset the intended benefits of the acquisitions, in whole or in part.
Additionally, potential acquisition opportunities become available to us from time to time, and we periodically engage in discussions or negotiations relating to potential acquisitions, including acquisitions that may be material in size or scope to our business. Any acquisition may or may not occur and, if an acquisition does occur, it may not be successful in enhancing our business for one or more of the following reasons:
| ● | any business acquired may not be integrated successfully and may not prove profitable; |
| ● | the price we pay for any business acquired may overstate the value of that business or otherwise be too high; |
| ● | liabilities we take on through the acquisition may prove to be higher than we expected; |
| ● | we may fail to achieve acquisition synergies; or |
| ● | the focus on the integration of operations of acquired entities may divert management’s attention from the day-to-day operation of our businesses. |
Acquisitions and strategic investments and alliances may also require us to integrate and collaborate with a different company culture, management team, business model, business infrastructure and sales and distribution methodology, and assimilate and retain geographically dispersed, decentralized operations and personnel. Depending on the size and complexity of an acquisition, our successful integration of the entity depends on a variety of factors, including introducing new products and meeting revenue targets as expected, the retention of key employees and key customers, increased exposure to certain governmental regulations and compliance requirements and increased costs and use of resources. Further, the integration of acquired businesses is likely to result in our systems and internal controls becoming increasingly complex and more difficult to manage. Any difficulties in the assimilation of acquired businesses into our control system could harm our operating results or cause us to fail to meet our financial reporting obligations.
Even if we are able to successfully integrate acquired businesses, we may not be able to realize the revenue and other synergies and growth that we anticipated from the acquisition in the time frame that we expected, and the costs of achieving these benefits may be higher than what we expected. As a result, the acquisition and integration of acquired businesses may not contribute to our earnings as expected and we may not achieve the other anticipated strategic and financial benefits of such transactions.
Impairment of our goodwill and other intangible assets has had, and in the future could have, a material non-cash adverse impact on our results of operations.
As of December 31, 2024, we had $51.7 million of goodwill and $170.5 million of other intangible assets on our balance sheets. We assess intangible assets for impairment on an annual basis in the fourth quarter or more frequently if we believe indicators of impairment exist. In addition, intangible assets and their related useful lives are reviewed at least annually to determine whether there are any adverse conditions that would indicate the carrying value of these assets may not be recoverable. Our valuation methodology for assessing impairment requires management to make judgments and assumptions based on experience and to rely heavily on projections of future operating performance. Because we operate in highly competitive environments, projections of our future operating results and cash flows may vary significantly from our actual results. We may be required to record non-cash impairment charges with respect to our goodwill or other intangible assets during any period we determine these assets are impaired, which has had, and in the future could have, a material adverse impact on our results of operations. For example, for the year ended December 31, 2024, we recorded non-cash impairment charges of $54.6 million related to the full impairment of the goodwill associated with our MVE reporting unit and $9.2 million related to the impairment of certain trademarks and tradenames.
27
Risks Related to Our Technology and Intellectual Property
We rely upon certain critical information systems, including our Cryoportal® software platform, for the operation of our business; the failure of any critical information system could adversely impact our reputation and future revenues, and we may be required to increase our spending on data and system security.
We rely upon certain critical information systems, including our Cryoportal® software platform which is used by our customers and business partners to automate the entry of orders, prepare customs documentation and facilitate status and location monitoring of shipped orders while in transit. In addition, the provision of services to our customers and the operation of our networks and systems involve the storage and transmission of significant amounts of proprietary information and sensitive or confidential data, including personal information of customers, employees and others. Our technology infrastructure and critical information systems are subject to damage or interruption from a number of potential sources, including unauthorized intrusions, cyberattacks, software viruses or other malware, natural disasters, power failures, employee error or malfeasances and other events. Despite our best efforts, no cybersecurity or emergency recovery process is failsafe, and if our safeguards fail or our technology infrastructure or critical information systems are compromised, the safety and efficiency of our operations could be materially harmed, our reputation could suffer, and we could face additional costs, liabilities, costly legal challenges.
Cyberattacks, data incidents and breaches in the security of our information systems and networks and of the electronic and confidential information in our possession could materially adversely impact our business, financial condition and results of operations, in addition to our reputation and relationships with our employees, customers, suppliers and business partners.
As part of our normal business activities, we collect and store or have access to certain proprietary confidential, and personal information, including information about our employees, customers, suppliers and business partners, which may be entitled to protection under a number of regulatory regimes. The protection and security of our network systems and our own information, as well as information relating to our employees, customers, suppliers, business partners and others, is vitally important to us. Any failure of us to maintain the security of our network systems and the proprietary, confidential, and personal data in our possession, including via the penetration of our network security and the misappropriation of proprietary, confidential and personal information, could result in costly investigations and remediation, business disruption, damage to our reputation, financial obligations to third parties, fines, penalties, regulatory proceedings and private litigation with potentially large costs, and also result in deterioration in our employees’, customers’, suppliers’ and business partners’ confidence in us and other competitive disadvantages, and thus could have a material adverse effect on our business, financial condition and results of operations.
The frequency, intensity, and sophistication of cyberattacks and data security incidents has significantly increased in recent years and is constant. As with many other businesses, we are continually subject to cyberattacks and the risk of data security incidents. Due to the increased risk of these types of attacks and incidents, we have implemented information technology and data security tools, measures, and processes designed to protect our networks systems, services, and the personal, confidential or proprietary information in our possession, and to ensure an effective response to any cyberattack or data security incident. We also have privacy and data security policies in place that are designed to detect, prevent, and/or mitigate cyberattacks and data security incidents. Whether or not these policies, tools, and measures are ultimately successful, the expenditures could have an adverse impact on our financial condition and results of operations, and divert management’s attention from pursuing our strategic objectives. As newer technologies evolve, we could be exposed to increased risks from cyberattacks, data security events, and data breaches, including those from human error, negligence or mismanagement or from illegal or fraudulent acts.
Although we take the security of our network systems and information seriously, there can be no assurance that the security measures we employ will effectively prevent unauthorized persons from obtaining unauthorized access to our systems and information due to the evolving nature and intensity of cyberattacks and threats to data security, in light of new and sophisticated tools and methods used by criminals and cyberterrorists to penetrate and compromise systems, including computer viruses, malware, ransomware, phishing, misrepresentation, social engineering and forgery, which make it increasingly challenging to anticipate, harder to detect, and more difficult to adequately mitigate these risks. While we have cyber security insurance, we may incur significant costs in the event of a successful cyber incident against us or in responding to and recovering from a cyber incident that are not covered by, or exceed the limits of, such insurance. Additionally, the cost and operational consequences of implementing, maintaining and enhancing further data or system protection measures could increase significantly to overcome increasingly intense, complex and sophisticated global cyber threats.
28
Our success depends, in part, on our ability to obtain patent protection for our solutions, preserve our trade secrets, and operate without infringing the proprietary rights of others.
Our policy is to seek to protect our proprietary position by, among other methods, filing United States patent applications related to our technology, inventions and improvements that are important to the development of our business. Our patents or patent applications may be challenged, invalidated or circumvented in the future or the rights granted may not provide a competitive advantage. We intend to vigorously protect and defend our intellectual property. Costly and time-consuming litigation brought by us may be necessary to enforce our patents and to protect our trade secrets and know-how, or to determine the enforceability, scope and validity of the proprietary rights of others.
We also rely upon trade secrets, technical know-how and continuing technological innovation to develop and maintain our competitive position. We seek to protect these trade secrets, in part, by entering into confidentiality agreements and inventions assignment and work for hire agreements in connection with employment, consulting, or advisory relationships. Despite these efforts, any of these parties may breach the agreements and disclose our proprietary information, including our trade secrets, and we may not be able to obtain adequate remedies for such breaches. Additionally, our competitors may independently develop substantially equivalent proprietary information and techniques or otherwise gain access to our proprietary technology, or we may not be able to meaningfully protect our rights in unpatented proprietary technology.
Our current and potential competitors and other third parties may have or obtain patents or additional proprietary rights that would prevent, limit or interfere with our ability to make, use or sell our solutions either in the United States or internationally. Additionally, we may face assertions of claims by holders of patents alleging that we are infringing upon their patent rights, which claims may be without merit, but may nonetheless result in our incurring substantial costs of defense.
Risks Related to Regulatory and Legal Matters
Complying with certain regulations that apply to shipments using our solutions can limit our activities and increase our cost of operations.
Shipments using our solutions and services are subject to various regulations in the various countries in which we operate. For example, shipments using our solutions may be required to comply with the shipping requirements promulgated by the CDC, the Occupational Safety and Health Organization (“OSHA”), the DOT as well as rules established by the IATA and the ICAO. Additionally, our data logger may be subject to regulation and certification by the FDA, the FCC, and the FAA. We will need to ensure that our solutions and services comply with relevant rules and regulations to make our solutions and services marketable, and in some cases, compliance is difficult to determine. Significant changes in such regulations could require costly changes to our solutions and services or prevent use of our shippers for an extended period of time while we seek to comply with changed regulations. If we are unable to comply with any of these rules or regulations or fail to obtain any required approvals, our ability to market our solutions and services may be adversely affected. In addition, even if we are able to comply with these rules and regulations, compliance can result in increased costs. In either event, our financial results and condition may be adversely affected. We depend on our business partners and unrelated and frequently unknown third-party agents in foreign countries to act on our behalf to complete the importation process and to make delivery of our shippers to the final user. The failure of these third parties to perform their duties could result in damage to the contents of the shipper resulting in customer dissatisfaction or liability to us, even if we are not at fault.
Changes in trade policy, tariff and import/export regulations may have a material adverse effect on our business, financial condition and results of operations.
Our international operations and transactions depend upon favorable trade relations between the United States and the foreign countries in which our customers and suppliers have operations. For example, the Trump administration instituted changes in trade policies that included the imposition of higher tariffs on imports into the U.S. and other government regulations affecting trade between the U.S. and other countries where we conduct our business. It may be time consuming and expensive for us to adapt to any changes in U.S. or international social, political, regulatory and economic conditions or in laws and policies governing foreign trade, manufacturing, development and investment in the territories or countries where we currently sell our products or conduct our business. If such changes occur, including as a result of these recent changes, this could adversely affect our business.
29
We, along with our customers, are subject to various international governmental regulations. Compliance with or changes in such regulations may cause us to incur significant expenses, and if we fail to maintain satisfactory compliance with certain regulations, we may be forced to recall products and cease their manufacture and distribution, and we could be subject to civil or criminal penalties.
We, along with our customers, are subject to various significant international, federal, state and local regulations, including but not limited to regulations in the areas of health and safety, packaging, product content, employment, labor and immigration, import/export controls, trade restrictions and anti-competition. In addition, as a global organization, we are subject to data privacy and security laws, regulations, and customer-imposed controls in numerous jurisdictions as a result of having access to and processing confidential, personal, sensitive and/or patient health data in the course of our business. The EU’s General Data Protection Regulation (“GDPR”), which became effective in May 2018, applies to our activities related to products and services that we offer to EU customers and workers. The GDPR established new requirements regarding the handling of personal data and includes significant penalties for non-compliance (including possible fines of up to 4 percent of total company revenue). Other governmental authorities around the world have passed or are considering similar types of legislative and regulatory proposals concerning data protection. Each of these privacy, security and data protection laws and regulations could impose significant limitations and increase our cost of providing our products and services where we process end user personal data and could harm our results of operations and expose us to significant fines, penalties and other damages.
We must also comply with complex foreign and U.S. laws and regulations, such as the U.S. Foreign Corrupt Practices Act, the U.K. Bribery Act, and other local laws prohibiting corrupt payments to governmental officials, anti-competition regulations and sanctions imposed by the U.S. Office of Foreign Assets Control and other similar laws and regulations. Violations of these laws and regulations could result in fines and penalties, criminal sanctions, restrictions on our business conduct and on our ability to offer our products in one or more countries, and could also materially affect our brand, our ability to attract and retain employees, our international operations, our business and our operating results. Although we have implemented policies and procedures designed to ensure compliance with these laws and regulations, there can be no assurance that our employees, contractors, or agents will not violate our policies.
These regulations are complex, change frequently and have tended to become more stringent over time. We may be required to incur significant expenses to comply with these regulations or to remedy any violations of these regulations. Any failure by us to comply with applicable government regulations could also result in the cessation of our operations or portions of our operations, product recalls or impositions of fines and restrictions on our ability to carry on or expand our operations. In addition, because many of our products are regulated or sold into regulated industries, we must comply with additional regulations in marketing our products. Any significant change in these regulations could reduce demand for our products, force us to modify our products to comply with new regulations or increase our costs of producing these products. If demand for our products is adversely affected or our costs increase, our operating results and business would suffer.
We are subject to regulation by the FDA or certain similar foreign regulatory agencies, and failure to comply with such regulations could harm our reputation, business, financial condition and results of operations.
Certain of our operations are subject to regulation by the FDA or similar foreign regulatory agencies. In addition, we may in the future develop products that are subject to regulation as medical devices by the FDA and similar foreign regulatory agencies. For example, we are aware that China’s National Medical Products Administration has had discussions that may require certain of our products to be registered as Class II medical devices. The regulations enforced by the FDA and similar foreign regulatory agencies govern a wide variety of product-related activities, including the research, development, testing, manufacture, quality control, approval, clearance, labeling, packaging, storage, record-keeping, promotion, advertising, distribution, marketing, post-approval monitoring and reporting, pricing, and export and import of pharmaceutical products. If we or any of our customers, suppliers or distributors fail to comply with FDA and other applicable foreign regulatory requirements or are perceived to potentially have failed to comply, we may face, among other things, warning letters; adverse publicity affecting both us and our customers; investigations or notices of non-compliance, fines, injunctions, and civil penalties; import or export restrictions; partial suspensions or total shutdown of production facilities or the imposition of operating restrictions; increased difficulty in obtaining required FDA clearances or approvals or foreign equivalents; seizures or recalls of our products or those of our customers; or the inability to sell our products and services. Any such FDA or other foreign regulatory agency actions could disrupt our business and operations, lead to significant remedial costs and have a material adverse impact on our financial position and results of operations.
30
Risks Related to Our Financial Condition
Historically, we have incurred significant losses and we may continue to incur losses in the future.
We incurred a net loss of $114.8 million and $99.6 million for the years ended December 31, 2024 and 2023, respectively. As of December 31, 2024, we had an accumulated deficit of $757.2 million. In order to achieve and sustain revenue growth in the future, we must expand our market presence and revenues from existing and new customers. We may continue to incur losses in the future and may never generate revenues sufficient to become profitable or to sustain profitability. Continuing losses may impair our ability to raise the additional capital required to continue and expand our operations.
Our indebtedness and liabilities could limit the cash flow available for our operations and expose us to risks that could adversely affect our business, financial condition and results of operations.
We have a substantial amount of indebtedness. As of December 31, 2024, we had approximately $301.6 million of indebtedness and other liabilities, including trade payables, on a consolidated basis. We may also incur additional indebtedness to meet future financing needs. Our indebtedness could have significant negative consequences for our security holders and our business, results of operations and financial condition by, among other things:
| ● | increasing our vulnerability to adverse economic and industry conditions; |
| ● | limiting our ability to obtain additional financing; |
| ● | requiring the dedication of a substantial portion of our cash flow from operations to service our indebtedness, which will reduce the amount of cash available for other purposes; |
| ● | limiting our flexibility to plan for, or react to, changes in our business; |
| ● | diluting the interests of our existing stockholders as a result of issuing shares of our common stock upon conversion of any convertible indebtedness; and |
| ● | placing us at a possible competitive disadvantage with competitors that are less leveraged than us or have better access to capital. |
Our business may not generate sufficient funds, and we may otherwise be unable to maintain sufficient cash reserves, to pay amounts due under our indebtedness, including our outstanding convertible senior notes (collectively, the “Convertible Senior Notes”) consisting of our 3.00% convertible senior notes due 2025 (the “2025 Convertible Senior Notes”) and our 0.75% convertible senior notes due 2026 (the “2026 Convertible Senior Notes”), and our cash needs may increase in the future. In addition, any future indebtedness that we may incur may contain financial and other restrictive covenants that limit our ability to operate our business, raise capital or make payments under our other indebtedness. If we fail to comply with these covenants or to make payments under our indebtedness when due, then we would be in default under that indebtedness, which could, in turn, result in that and our other indebtedness becoming immediately payable in full.
Risks Related to Our Preferred Stock
The issuance of shares of our Series C Preferred Stock reduces the relative voting power of holders of our common stock, dilutes the ownership of such holders, and may adversely affect the market price of our common stock.
In connection with financing our acquisition of MVE Biological Solutions, on October 1, 2020, we completed the sale of 250,000 shares of a newly designated Series C Convertible Preferred Stock, par value $0.001 (“Series C Preferred Stock”), at a price of $1,000 per share, the original purchase price, to funds affiliated with The Blackstone Group Inc., or Blackstone. The holders of our Series C Preferred Stock are entitled to dividends at a rate of 4.0% per annum, paid-in-kind, accruing daily and paid quarterly in arrears and are also entitled to participate in dividends declared or paid on the common stock on an as-converted basis.
Each holder of our Series C Preferred Stock (collectively, the “Series C Preferred Stockholders”) has the right, at its option, to convert its Series C Preferred Stock, in whole or in part, into common stock at a conversion price equal to $38.6152 per share subject to certain customary adjustments. Subject to certain conditions, we may, at our option, require conversion of all of the outstanding shares of Series C Preferred Stock to common stock if, for at least 20 trading days during the 30 consecutive trading days immediately preceding the date we notify the Series C Preferred Stockholders of the election to convert, the closing price of our common stock is at least 150% of the conversion price. On February 5, 2021, the Company received a waiver and conversion notice from Blackstone Freeze Parent
31
L.P. and Blackstone Tactical Opportunities Fund – FD L.P. and converted an aggregate of 50,000 shares of the Series C Preferred Stock, resulting in the issuance of an aggregate of 1,312,860 shares of common stock.
Any subsequent conversion of shares of the Series C Preferred Stock to shares of our common stock would further dilute the ownership interest of existing holders of our common stock, and any sale in the public market of shares of our common stock issuable upon conversion of the Series C Preferred Stock could adversely affect prevailing market prices of our common stock. Additionally, we granted the Series C Preferred Stockholders customary registration rights in respect of their securities. These registration rights facilitate the resale of our common stock issuable upon conversion of such securities into the public market, and any such resale would increase the number of shares of our common stock available for public trading.
The Series C Preferred Stockholders may exercise influence over us, including through their right to nominate for election one member to our board of directors.
The Series C Preferred Stockholders are generally entitled to vote with the holders of the shares of common stock on all matters submitted for a vote of holders of shares of Common Stock (voting together with the holders of shares of common stock as one class) on an as-converted basis, subject to certain NASDAQ voting limitations, if applicable. Additionally, the consent of the holders of a majority of the outstanding shares of Series C Preferred Stock is required for so long as any shares of the Series C Preferred Stock remain outstanding for (i) amendments to the Company’s organizational documents that have an adverse effect on the holders of Series C Preferred Stock and (ii) issuances by the Company of securities that are senior to, or equal in priority with, the Series C Preferred Stock, including any shares of the Company’s Class A Preferred Stock or Class B Preferred Stock. In addition, for so long as 75% of the Series C Preferred Stock issued in connection with the related securities purchase agreement remains outstanding, the consent of the holders of a majority of the outstanding shares of Series C Preferred Stock will be required for (i) any voluntary dissolution, liquidation, bankruptcy, winding up or deregistration or delisting and (ii) incurrence by Cryoport of any indebtedness unless our ratio of debt to LTM EBITDA (as defined in the Certificate of Designation of the Series C Preferred Stock) would be less than a ratio of 5-to-1 on a pro forma basis giving effect to such incurrence and the use of proceeds therefrom.
Additionally, an affiliate of Blackstone has the right to nominate for election one member to our board of directors for so long as certain parties hold 66.67% of the Series C Preferred Stock issued in the Blackstone financing transaction. If elected, the director designated by Blackstone is entitled to serve on committees of our board of directors, subject to applicable law and NASDAQ rules. Notwithstanding the fact that all directors will be subject to fiduciary duties to us and to applicable law, the interests of the director designated by Blackstone may differ from the interests of our security holders as a whole or of our other directors.
As a result, the Series C Preferred Stockholders have the ability to influence the outcome of certain matters affecting our governance and capitalization. The sponsors of the Series C Preferred Stockholders are in the business of making or advising on investments in companies, including businesses that may directly or indirectly compete with certain portions of our business, and they may have interests that diverge from, or even conflict with, those of our other shareholders. They may also pursue acquisition opportunities that may be complementary to our business, and, as a result, those acquisition opportunities may not be available to us. Our obligations to the Series C Preferred Stockholders could also limit our ability to obtain additional financing or increase our borrowing costs, which could have an adverse effect on our financial condition.
Our Series C Preferred Stock has rights, preferences, and privileges that are not held by, and are preferential to, the rights of holders of our common stock, which could adversely affect our liquidity and financial condition.
The Series C Preferred Stockholders have the right under the Certificate of Designation of the Series C Preferred Stock to receive a liquidation preference entitling them to be paid an amount per share equal to the greater of (i) the original purchase price, plus all accrued and unpaid dividends and (ii) the amount that the holder would have been entitled to receive at such time if the Series C Preferred Stock were converted into common stock. In addition, the Series C Preferred Stockholders are entitled to dividends at a rate of 4.0% per annum, paid-in-kind, accruing daily and paid quarterly in arrears. The Series C Preferred Stockholders are also entitled to participate in dividends declared or paid on the common stock on an as-converted basis.
32
Risks Related to Ownership of Our Common Stock
Certain of our existing stockholders own and have the right to acquire a substantial number of shares of common stock.
As of February 28, 2025, our directors, executive officers and beneficial owners of 5% or more of our outstanding common stock beneficially owned 38,410,042 shares of common stock assuming their conversion of all outstanding Series C Preferred Stock and their exercise of all outstanding options held by them that are exercisable within 60 days of February 28, 2025, which represented approximately 71.1% of our outstanding common stock. As such, the concentration of beneficial ownership of our common stock may have the effect of delaying or preventing a change in control of Cryoport and may adversely affect the voting or other rights of other holders of our common stock.
Future sales of shares of our common stock may depress the price of our shares and be dilutive to our existing stockholders.
Future issuances of shares of our common stock or the availability of shares for resale in the open market may decrease the market price per share of our common stock. As of February 28, 2025, there were 49,910,391 shares of our common stock outstanding. Substantially all of these shares of common stock are eligible for trading in the public market. The market price of our common stock may decline if our stockholders sell a large number of shares of our common stock in the public market, or the market perceives that such sales may occur.
As of December 31, 2024, we could also issue up to an additional 7,841,565 shares of our common stock upon exercise of outstanding options and vesting of restricted stock units and 2,896,124 shares of our common stock reserved for future issuance under our stock incentive plans. In addition, we reserved 599,953 shares of our common stock issuable upon conversion of the 2025 Convertible Senior Notes, 1,583,280 shares of our common stock issuable upon conversion of the 2026 Convertible Senior Notes, and 6,133,876 shares of our common stock issuable upon conversion of our Series C Preferred Stock. The exercise of any options or vesting of restricted stock units, as well as the issuance of our common stock upon conversion of the Convertible Senior Notes, the Series C Preferred Stock, or in connection with acquisitions and other issuances of our common stock, could have an adverse effect on the market price of the shares of our common stock and dilute our existing stockholders.
To the extent that we raise additional funds through the sale of equity or convertible debt securities, the issuance of such securities will result in dilution to our stockholders. Further, investors purchasing shares or other securities in the future could have rights superior to existing stockholders.
Our stock price has been and will likely continue to be volatile.
The market price of our common stock has been highly volatile and could fluctuate widely in price in response to various factors, many of which are beyond our control, including, but not limited to technological innovations or new solutions and services by us or our competitors, additions or departures of key personnel, sales of our common stock, our ability to execute our business plan, our operating results being below expectations, loss of any strategic relationship, industry developments, economic and other external factors and period-to-period fluctuations in our financial results.
In addition, the securities markets have from time-to-time experienced significant price and volume fluctuations that are unrelated to the operating performance of companies. These market fluctuations may also materially and adversely affect the market price of our common stock.
We have not paid dividends on our common stock in the past and do not expect to pay dividends in the foreseeable future. Any return on investment may be limited to the value of our common stock.
We have never paid cash dividends on our common stock and do not anticipate paying cash dividends in the foreseeable future. Any future determination to pay dividends will be at the discretion of our board of directors, subject to compliance with covenants in current and future agreements governing our indebtedness, and will depend on our results of operations, financial condition, capital requirements, contractual arrangements and other factors that our board of directors deems relevant. If we do not pay dividends, our common stock may be less valuable because a return on your investment will only occur if the price of our common stock appreciates.
33
Our Articles of Incorporation allows our board of directors to issue up to 2,500,000 shares of “blank check” preferred stock.
Our Articles of Incorporation allows our board of directors to issue up to 2,500,000 shares of “blank check” preferred stock, without action by our stockholders. We have designated 800,000 shares as Class A Preferred Stock, 585,000 shares as Class B Preferred Stock and 250,000 shares of Series C Preferred Stock, of which 200,000 shares of Series C Preferred Stock are issued and outstanding at February 23, 2024. See “—Risks Related to Our Preferred Stock” for additional information regarding our outstanding Series C Preferred Stock. Without limiting the foregoing, (i) such shares of preferred stock could have liquidation rights that are senior to the liquidation preference applicable to our common stock and Preferred Stock, (ii) such shares of preferred stock could have voting or conversion rights, which could adversely affect the voting power of the holders of our common stock and preferred stock and (iii) the ownership interest of holders of our common stock will be diluted following the issuance of any such shares of preferred stock. In addition, the issuance of such shares of blank check preferred stock could have the effect of discouraging, delaying or preventing a change of control of our Company.
Provisions in our bylaws and Nevada law might discourage, delay or prevent a change of control of our Company or changes in our management and, as a result, may depress the trading price of our common stock.
Provisions of our bylaws and Nevada law may discourage, delay or prevent a merger, acquisition or other change in control that stockholders may consider favorable, including transactions in which you might otherwise receive a premium for your shares of our common stock. The relevant bylaw provisions may also prevent or frustrate attempts by our stockholders to replace or remove our management. These provisions include advance notice requirements for stockholder proposals and nominations, and the ability of our board of directors to make, alter or repeal our bylaws.
In addition, Section 78.411, et seq. of the Nevada Revised Statutes prohibits a publicly-held Nevada corporation from engaging in a business combination with an interested stockholder (generally defined as a person which together with its affiliates owns, or within the last two years has owned, 10% of our voting stock) for a period of two years after the date of the transaction in which the person became an interested stockholder, unless the business combination is approved in a prescribed manner.
The existence of the foregoing provisions and other potential anti-takeover measures could limit the price that investors might be willing to pay in the future for shares of our common stock. They could also deter potential acquirers of our Company, thereby reducing the likelihood that you could receive a premium for your common stock in an acquisition.
General Risk Factors
Our ability to grow and compete in our industry will be hampered if we are unable to retain the continued service of our key professionals or to identify, hire and retain additional qualified professionals.
Our success in implementing our business strategy depends largely on the skills, experience and performance of key members of our executive management team and others in key management positions. The collective efforts of each of these persons working as a team will be critical to us as we continue to develop our technologies, tests and engineering and development and sales programs. As a result of the difficulty in locating qualified new management, the loss or incapacity of existing members of our executive management team could adversely affect our operations. If we were to lose one or more of these key employees, we could experience difficulties in finding qualified successors, competing effectively, developing our technologies and implementing our business strategy. We do not maintain “key person” insurance on any of our employees.
In addition, a critical factor to our business is our ability to attract and retain qualified professionals including key employees and consultants. We are continually at risk of losing current professionals or being unable to hire additional professionals as needed. If we are unable to attract new qualified employees, our ability to grow will be adversely affected. If we are unable to retain current employees or strategic consultants, our financial condition and ability to maintain operations may be adversely affected.
34
If equity research analysts do not publish research or reports about our business or if they issue unfavorable commentary or downgrade our common stock, the price of our common stock could decline.
The trading market for our common stock relies in part on the research and reports that equity research analysts publish about us and our business. We do not control these analysts. The price of our common stock could decline if one or more equity analyst downgrades our stock or if analysts downgrade our stock or issue other unfavorable commentary or cease publishing reports about us or our business.
ITEM 1B. Unresolved Staff Comments
Not applicable.
ITEM 1C. Cybersecurity
Risk Management and Strategy
We identify and assess material risks from cybersecurity threats to our information systems and the information residing in our information systems by monitoring and evaluating our threat environment on an ongoing basis using various methods including, for example, using manual and automated tools, subscribing to reports and services that identify cybersecurity threats, analyzing reports of threats and threat actors, conducting scans of the threat environment, and conducting risk assessments.
Governance
35
ITEM 2. Properties
Our principal executive office is located in Brentwood, Tennessee. We lease or own various corporate, global logistics and supply chain centers, biostorage, manufacturing, and research and development facilities at over 50 sites across the Americas, EMEA and APAC regions.
The following table summarizes our principal facilities and other materially important physical properties as of December 31, 2024:
Location |
|
Ownership |
|
Use |
Brentwood, Tennessee |
Leased |
Principal Executive Office |
||
Irvine, California |
Leased |
Administrative, Global Supply Chain Center, and Research and Development Center |
||
Morris Plains, New Jersey |
Leased |
Global Supply Chain Center, Administrative, and Logistics Center |
||
Houston, Texas |
Leased |
Administrative, Global Supply Chain Center and Biostorage Center |
||
Hoofddorp, the Netherlands |
Leased |
Global Supply Chain Center |
||
Ball Ground, Georgia |
Leased |
Administrative, Manufacturing, and Research and Development Center |
||
New Prague, Minnesota |
Owned |
Manufacturing |
||
Chengdu, China |
Owned |
Administrative and Manufacturing |
||
Clermont-Ferrand, France |
Owned |
Administrative and Global Supply Chain Center |
||
Lisbon, Portugal |
Leased |
Administrative |
||
Tremblay en France, France |
Leased |
Administrative and Global Logistics Center |
We believe that these facilities are adequate, suitable and of sufficient capacity to support our immediate needs.
ITEM 3. Legal Proceedings
In the ordinary course of business, we are at times subject to various legal proceedings and disputes, including product liability claims. We currently are not aware of any such legal proceedings or claim that we believe will have, individually or in the aggregate, a material adverse effect on our business, operating results or cash flows. It is our practice to accrue for open claims based on our historical experience and available insurance coverage.
ITEM 4. Mine Safety Disclosures
Not applicable
36
PART II
ITEM 5. Market for Registrant’s Common Equity, Related Stockholder Matters and Issuer Purchases of Equity Securities
Common Stock
As of February 28, 2025, there were 49,910,391 shares of common stock outstanding and 153 stockholders of record. Because many shares of our common stock are held by brokers and other institutions on behalf of stockholders, we are unable to estimate the total number of stockholders represented by these stockholders of record.
Market Information
The Company’s common stock is currently listed on the NASDAQ Capital Market and is traded under the symbol “CYRX.”
Stock Performance Graph (1)
The graph below compares Cryoport’s cumulative 5-year total shareholder return on common stock with the cumulative total returns of the Russell 3000 Index and S&P 1500 Life Sciences Tools & Services Industry Index. The graph tracks the performance of a $100 investment in our common stock and in each index from December 31, 2019 to December 31, 2024 and assumes that, as to such indices, dividends were reinvested. We have never paid cash dividends on our common stock. The stock price performance on the following graph is not necessarily indicative of future stock price performance.
COMPARISON OF 5 YEAR CUMULATIVE TOTAL RETURN*
Among Cryoport, Inc., the Russell 3000 Index and the S&P 1500 Life Sciences Tools & Services Industry Index
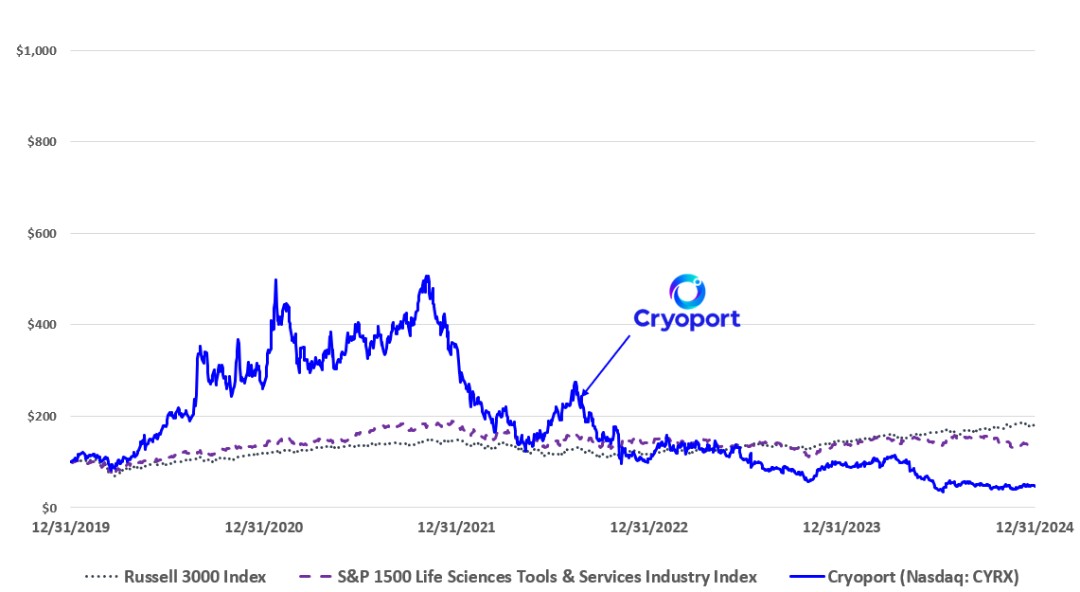
*$100 invested on 12/31/19 in Cryoport common stock or applicable index. Fiscal year ending December 31.
(1) |
The information contained in the performance graph shall not be deemed to be “soliciting material” or to be “filed” with the SEC, and such information shall not be incorporated by reference into any future filing under the Securities Act or the Exchange Act, except to the extent that Cryoport specifically incorporates it by reference into such filing. |
37
Dividends
No dividends on common stock have been declared or paid by the Company. The Company intends to employ all available funds for the development of its business and, accordingly, does not intend to pay any cash dividends in the foreseeable future. Any future determination to pay dividends will be at the discretion of our board of directors, subject to compliance with covenants in current and future agreements governing our indebtedness, and will depend on our results of operations, financial condition, capital requirements, contractual arrangements and other factors that our board of directors deems relevant.
Recent Sale of Unregistered Securities
None.
Issuer Purchases of Equity Securities
None.
ITEM 6. [Reserved]
ITEM 7. Management’s Discussion and Analysis of Financial Condition and Results of Operations
The following discussion and analysis of our financial condition and results of our operations should be read in conjunction with our consolidated financial statements and related notes included elsewhere in this Form 10-K. Our actual results could differ materially from those contained in forward-looking statements due to a number of factors. See “Forward-Looking Statements” in this Form 10-K.
For further discussion and analysis regarding our financial condition and results of operations for the year ended December 31, 2023 as compared to the year ended December 31, 2022, refer to “Part II, Item 7 - Management’s Discussion and Analysis of Financial Condition and Results of Operations” in our Annual Report on Form 10-K for the fiscal year ended December 31, 2023 filed with the SEC on March 13, 2024.
General Overview
Cryoport is a leading global provider of innovative products and services supporting the life sciences in the biopharma/pharma, animal health, and reproductive medicine markets. Our mission is to enable the future of medicine for a new era of life sciences. With over 50 strategic locations covering the Americas, EMEA (Europe, the Middle East and Africa) and APAC (Asia Pacific), Cryoport's global platform provides mission-critical bio-logistics, bio-storage, bio-processing, and cryogenic systems to over 3,000 customers worldwide. Our platform of solutions and services, together with our global team of over 1,100 dedicated colleagues, delivers a unique combination of innovative supply chain technologies and services through our industry-leading brands, including Cryoport Systems, MVE Biological Solutions, CRYOPDP, and CRYOGENE.
See the “Business” section in Part I, Item 1 of this Form 10-K for additional information.
Impact of Inflation
Inflation generally impacts us by increasing our costs of labor, material, transportation and pricing from third party manufacturers. While the rates of inflation have not had a material impact on our financial statements in the past, we have seen some impact on gross margins in 2023 and 2022. Based on the current economic outlook, inflationary pressures could affect our financial performance in the future if cost increases cannot be offset by net realized annual price increases and productivity gains.
Critical Accounting Policies and Estimates
Our discussion and analysis of our consolidated financial condition and results of operations are based upon our consolidated financial statements, which have been prepared in conformity with accounting principles generally accepted in the U.S., or U.S. GAAP.
38
While our significant accounting policies are more fully described in the notes to our consolidated financial statements, we have identified the policies and estimates below as being critical to our business operations and the understanding of our results of operations. These policies require management’s most difficult, subjective or complex judgements, often as a result of the need to make estimates about the effect of matters that are inherently uncertain. The impact of and any associated risks related to these policies on our business operations are discussed throughout “Management’s Discussion and Analysis of Financial Condition,” including in the “Results of Operations” section, where such policies affect our reported and expected financial results. Although we believe that our estimates, assumptions, and judgements are reasonable, they are based upon information presently available. Actual results may differ significantly from these estimates under different assumptions, judgments, or conditions.
The SEC defines critical accounting policies as those that are, in management’s view, most important to the portrayal of our financial condition and results of operations and most demanding of our judgment. We consider the following policies and estimates to be critical to an understanding of our consolidated financial statements and the uncertainties associated with the complex judgments made by us that could impact our results of operations, financial position and cash flows: Revenue Recognition, Business Combinations, Intangible Assets and Goodwill, Convertible Senior Notes, Stock-based Compensation, and Income Taxes. See Note 2: “Summary of Significant Accounting Policies” of our accompanying consolidated financial statements for a description of our critical accounting policies and estimates.
Revenue Recognition
Revenues are recognized when control is transferred to customers, in an amount that reflects the consideration the Company expects to be entitled to in exchange for those goods and services. Revenue recognition is evaluated through the following five steps: (i) identification of the contract, or contracts, with a customer; (ii) identification of the performance obligations in the contract; (iii) determination of the transaction price; (iv) allocation of the transaction price to the performance obligations in the contract; and (v) recognition of revenue when or as a performance obligation is satisfied.
Performance Obligations
At contract inception, an assessment of the goods and services promised in the contracts with customers is performed and a performance obligation is identified for each distinct promise to transfer to the customer a good or service (or bundle of goods or services). To identify the performance obligations, the Company considers all of the goods or services promised in the contract regardless of whether they are explicitly stated or are implied by customary business practices. Revenue is recognized when our performance obligation has been met. The Company considers control to have transferred upon delivery because the Company has a present right to payment at that time since the Company has satisfied its performance obligations related to the successful delivery. In instances where the customer has elected to use their own freight, revenue is recognized upon delivery of the shipper to the customer.
For arrangements under which the Company provides biological specimen storage services and logistics support and management to the customer, the Company satisfies its performance obligations as those services are performed whereby the customer simultaneously receives and consumes the benefits of such services under the agreement.
Revenue generated from short-term logistics and engineering consulting services provided to customers is recognized when the Company satisfies the contractually defined performance obligations. When a contract includes multiple performance obligations, the contract price is allocated among the performance obligations based upon the stand-alone selling prices. Approved contract modifications are accounted for as either a separate contract or as part of the existing contract depending on the nature of the modification.
Our performance obligations on our orders and under the terms of agreements with customers are generally satisfied within one year from a given reporting date and, therefore, we omit disclosure of the transaction price allocated to remaining performance obligations on open orders.
Shipping and handling activities related to contracts with customers are accounted for as costs to fulfill our promise to transfer the associated products pursuant to the accounting policy election allowed under Topic 606 and are not considered a separate performance obligation to our customers. Accordingly, the Company records amounts billed for shipping and handling as a component of revenue. Shipping and handling fees and costs are included in cost of revenues in the accompanying condensed consolidated statements of operations.
39
Revenues are recognized net of any taxes collected from customers, which are subsequently remitted to governmental agencies.
Business Combinations
Amounts paid for acquisitions are allocated to the tangible and intangible assets acquired and liabilities assumed, if any, based on their fair values at the dates of acquisition. This purchase price allocation process requires management to make significant estimates and assumptions with respect to intangible assets. The fair value of identifiable intangible assets is based on detailed valuations that use information and assumptions determined by management. Any excess of purchase price over the fair value of the net tangible and intangible assets acquired is allocated to goodwill. While we use our best estimates and assumptions to accurately value assets acquired and liabilities assumed at the acquisition date as well as any contingent consideration, where applicable, our estimates are inherently uncertain and subject to refinement. As a result, during the measurement period, which may be up to one year from the acquisition date, we record adjustments to the assets acquired and liabilities assumed with the corresponding offset to goodwill. Upon conclusion of the measurement period or final determination of the values of assets acquired or liabilities assumed, whichever comes first, any subsequent adjustments are recorded to our consolidated statements of operations.
We use the income approach to determine the fair value of certain identifiable intangible assets such as customer relationships. This approach determines fair value by estimating after-tax cash flows attributable to these assets over their respective useful lives and then discounting these after-tax cash flows back to a present value. We base our assumptions on estimates of future cash flows, expected growth rates, expected trends in technology, etc. We base the discount rates used to arrive at a present value as of the date of acquisition on the time value of money and certain industry-specific risk factors. We believe the estimated purchased customer relationships, agent networks, software, developed technologies, and trademarks/tradenames so determined represent the fair value at the date of acquisition and do not exceed the amount a third party would pay for the assets.
Intangible Assets and Goodwill
Intangible assets
Intangible assets with a definite life are amortized over their useful lives using the straight-line method, which is the best estimate of the value we are receiving over the useful life of the intangible asset and another systematic method was not deemed more appropriate. The amortization expense is recorded within selling, general and administrative expense in the consolidated statements of operations. Intangible assets and their related useful lives are reviewed at least annually to determine if any adverse conditions exist that would indicate the carrying value of these assets may not be recoverable. More frequent impairment assessments are conducted if certain conditions exist, including a change in the competitive landscape, any internal decisions to pursue new or different technology strategies, a loss of a significant customer, or a significant change in the marketplace, including changes in the prices paid for the Company’s products or changes in the size of the market for the Company’s products. If impairment indicators are present, the Company determines whether the underlying intangible asset is recoverable through estimated future undiscounted cash flows. If the asset is not found to be recoverable, it is written down to the estimated fair value of the asset based on the sum of the future discounted cash flows expected to result from the use and disposition of the asset. If the estimate of an intangible asset’s remaining useful life is changed, the remaining carrying amount of the intangible asset is amortized prospectively over the revised remaining useful life. The Company continues to believe that its definite-lived intangible assets are recoverable at December 31, 2024. The Company has performed an interim impairment assessment as of June 30, 2024, and concluded that there has been no impairment of our intangible assets for the periods presented.
Indefinite-lived intangible assets are comprised of trade name/trademarks acquired in the Company’s recent acquisitions, and are tested for impairment annually using a relief from royalty method that relies on estimates of future revenues, royalty rates, and discount rates. If the asset is not found to be recoverable, it is written down to the estimated fair value. As a result of an interim impairment assessment performed as of June 30, 2024, we recorded a $9.0 million impairment charge related to trademarks for our MVE reporting unit, and a $0.3 million impairment charge related to the write-off of Cell&Co’s trade name that is no longer in use as a result of the Company’s global rebranding initiative (see Note 10).
Goodwill
We test goodwill for impairment on an annual basis in the fourth quarter or more frequently if management believes indicators of impairment exist. Events that would indicate impairment and trigger an interim impairment assessment include, but are not limited to, current economic and market conditions, including a decline in market capitalization, a significant adverse change in legal factors,
40
business climate or operational performance of the business, and an adverse action or assessment by a regulator. Accounting guidance also permits an optional qualitative assessment for goodwill to determine whether it is more likely than not that the carrying value of a reporting unit exceeds its fair value. If, after this qualitative assessment, we determine that it is not more likely than not that the fair value of a reporting unit is less than its carrying amount, then no further quantitative testing would be necessary. A quantitative assessment is performed if the qualitative assessment results in a more likely than not determination or if a qualitative assessment is not performed. The quantitative assessment considers whether the carrying amount of a reporting unit exceeds its fair value, in which case an impairment charge is recorded to the extent the reporting unit’s carrying value exceeds its fair value. As a result of an interim impairment assessment performed as of June 30, 2024, we concluded that there has been no impairment of the goodwill associated with the CRYOPDP reporting unit as its carrying value did not exceed its estimated fair value. We further concluded that goodwill related to the MVE reporting unit is impaired, and recorded an impairment charge of $54.6 million in the consolidated statement of operations for the year ended December 31, 2024 (see Note 10).
Convertible Senior Notes
The Convertible Senior Notes are accounted for in accordance with ASC 470-20, Debt with Conversion and Other Options (“ASC 470-20”) and ASC 815-40, Contracts in Entity’s Own Equity (“ASC 815-40”). Under ASC 815-40, to qualify for equity classification (or nonbifurcation, if embedded) the instrument (or embedded feature) must be both (1) indexed to the issuer’s stock and (2) meet the requirements of the equity classification guidance. Based upon the Company’s analysis, it was determined the Convertible Senior Notes do contain embedded features indexed to its own stock, but do not meet the requirements for bifurcation and recognition as derivatives, and therefore do not need to be separately recognized. Accordingly, the proceeds received from the issuance of the Convertible Senior Notes were recorded as a single liability on the consolidated balance sheets.
Stock-based Compensation
We use the Black-Scholes option pricing model to calculate the fair value of stock option awards on the grant date. The expected option life assumption is estimated based on the simplified method. Accordingly, the Company has utilized the average of the contractual term of the options and the weighted average vesting period for all options to calculate the expected option term. The risk-free interest rate assumption is based upon observed interest rates appropriate for the expected term of our employee stock options. The expected volatility is based on the average of the historical volatility and the implied volatility of our stock commensurate with the expected life of the stock-based award. We do not anticipate paying dividends on our common stock in the foreseeable future.
We recognize stock-based compensation cost on a straight-line basis over the vesting period. Stock-based compensation expense is recognized only for those awards that ultimately vest.
Income Taxes
Deferred taxes are determined based on the difference between the financial statement and tax basis of assets and liabilities using enacted tax rates in effect in the years in which the differences are expected to reverse. Valuation allowances are provided, if, based upon the weight of available evidence, it is more likely than not that some or all of the deferred tax assets will not be realized. We account for uncertain tax positions using a “more-likely-than-not” threshold for recognizing and resolving uncertain tax positions. The evaluation of uncertain tax positions is based on factors including, but not limited to, changes in tax law, the measurement of tax positions taken or expected to be taken in tax returns, the effective settlement of matters subject to audit, new audit activity and changes in facts or circumstances related to a tax position. We evaluate our tax position on a quarterly basis. We also accrue for potential interest and penalties related to unrecognized tax benefits in income tax expense.
41
Results of Operations
Results of Operations for Year Ended December 31, 2024 Compared to the Year Ended December 31, 2023
The following table summarizes certain information derived from our consolidated statements of operations (in thousands):
Year Ended December 31, |
|||||||||||
2024 |
|
2023 |
|
$ Change |
|
% Change |
|||||
Life sciences services revenue |
$ |
153,660 |
$ |
144,087 |
$ |
9,573 |
|
6.6% |
|||
Life sciences products revenue |
|
74,725 |
|
89,168 |
|
(14,443) |
|
(16.2%) |
|||
Total revenue |
|
228,385 |
|
233,255 |
|
(4,870) |
|
(2.1%) |
|||
Cost of services revenue |
(85,206) |
(81,820) |
(3,386) |
4.1% |
|||||||
Cost of products revenue |
(43,548) |
(52,103) |
8,555 |
(16.4%) |
|||||||
Total cost of revenue |
(128,754) |
(133,923) |
5,169 |
(3.9%) |
|||||||
Gross margin |
|
99,631 |
|
99,332 |
|
299 |
|
0.3% |
|||
Selling, general and administrative |
|
(148,978) |
|
(146,880) |
|
(2,098) |
|
1.4% |
|||
Engineering and development |
|
(17,710) |
|
(18,040) |
|
330 |
|
(1.8%) |
|||
Impairment loss |
(63,809) |
(49,569) |
(14,240) |
|
28.7% |
||||||
Investment income |
9,895 |
10,577 |
(682) |
(6.4%) |
|||||||
Interest expense |
|
(4,108) |
|
(5,503) |
|
1,395 |
|
(25.3%) |
|||
Gain on extinguishment of debt, net |
18,505 |
5,679 |
12,826 |
225.8% |
|||||||
Other income (expense), net |
|
(6,906) |
|
5,056 |
|
(11,962) |
|
(236.6%) |
|||
Provision for income taxes |
|
(1,276) |
|
(239) |
|
(1,037) |
|
434.1% |
|||
|
|
|
|
|
|
|
|||||
Net loss |
$ |
(114,756) |
$ |
(99,587) |
$ |
(15,169) |
|
15.2% |
|||
Paid-in-kind dividend on Series C convertible preferred stock |
(8,000) |
(8,000) |
— |
— |
|||||||
Net loss attributable to common stockholders |
$ |
(122,756) |
$ |
(107,587) |
$ |
(15,169) |
|
14.1% |
|||
Total revenue by market
Year Ended December 31, |
||||||||||||
|
2024 |
|
2023 |
|
$ Change |
% Change |
|
|||||
($ in 000’s) |
|
|||||||||||
BioLogistics Solutions |
$ |
138,635 |
$ |
130,498 |
$ |
8,137 |
6.2 |
% |
||||
BioStorage/BioServices |
|
15,025 |
|
13,589 |
|
1,436 |
10.6 |
% |
||||
Life Sciences Services |
|
153,660 |
|
144,087 |
|
9,573 |
6.6 |
% |
||||
Life Sciences Products |
74,725 |
89,168 |
$ |
(14,443) |
(16.2) |
% |
||||||
Total revenue |
$ |
228,385 |
$ |
233,255 |
(4,870) |
(2.1) |
||||||
Revenue. Revenue decreased by $4.9 million, or 2.1%, to $228.4 million for the year ended December 31, 2024, as compared to $233.3 million for the year ended December 31, 2023.
Revenue by type
Life Sciences Services revenue increased by $9.6 million, or 6.6%, from $144.1 million to $153.7 million for the year ended December 31, 2024, as compared to the same period in 2023. This increase was driven by year-over-year growth in BioStorage/BioServices and Commercial Cell & Gene therapy revenue of 10.6% and 20.1%, respectively, demonstrating strong demand for our services offerings. We also continued to gain clinical trial market share with Cryoport supporting a total of 701 clinical trials globally at year end 2024, of which 81 of these clinical trials were in phase 3, representing an overall increase of 26 clinical trials from 675 clinical trials at year end 2023. Our company continues to lead the way in providing advanced temperature-controlled supply chain solutions designed to support the development of cell & gene therapies and our future growth.
42
Life Sciences Products revenue decreased by $14.4 million, or 16.2%, from $89.2 million to $74.7 million for the year ended December 31, 2024, as compared to the same period in 2023. This was primarily a result of decreased demand for cryogenic systems that commenced during the second quarter of 2023. Life Sciences Products revenue consists primarily of revenue from our portfolio of cryogenic stainless-steel freezers, aluminum dewars and related ancillary equipment used in the storage and transport of life sciences commodities, which includes the rapidly growing Cell and Gene Therapy market through a global network of distributors and direct client relationships.
Gross margin and cost of revenue. Gross margin for the year ended December 31, 2024 was 43.6% of total revenue, as compared to 42.6% of total revenue for the year ended December 31, 2023. Cost of total revenue decreased $5.2 million to $128.8 million for the year ended December 31, 2024, as compared to $133.9 million in the same period in 2023.
Gross margin for our life sciences services revenue was 44.5% of services revenue, as compared to 43.2% of services revenue for the year ended December 31, 2023. Our cost of revenue is primarily comprised of freight charges, payroll and associated expenses related to our global logistics and supply chain centers, depreciation expenses of our Cryoport Express® Shippers and supplies and consumables used for our solutions.
Gross margin for our life sciences products revenue remained flat at 41.7% of products revenue, as compared to 41.6% of products revenue for the year ended December 31, 2023. Life Sciences Products revenue, related cost of revenue and resulting gross margins were primarily driven by our MVE Biological Solutions business. Our cost of products revenue was primarily comprised of materials, direct and indirect labor, inbound freight charges, purchasing and receiving, inspection, and distribution and warehousing of inventory. In addition, shop supplies, facility maintenance costs and depreciation expense for assets used in the manufacturing process were included in cost of products revenue.
Selling, general and administrative expenses. Selling, general and administrative (“SG&A”) expenses include the costs associated with selling our products and services and costs required to support our marketing efforts including legal, accounting, patent, shareholder services, amortization of intangible assets and other administrative functions.
For the year ended December 31, 2024, SG&A expenses increased by $2.1 million, or 1.4% as compared to the same period in 2023. This increase is driven by the further build out of our competencies and infrastructure to support the continuing scaling of our business and demand for Cryoport’s systems and solutions and buildout of new competencies, such as IntegriCellTM platform, a standardized integrated apheresis cryopreservation and distribution solution for cell therapies. In October 2024, we announced the launch of our new state-of-the-art IntegriCellTM facility within our Houston campus. This offering addresses another critical aspect in optimizing the supply chain for the development and commercialization of cell-based therapies. Wages and associated employee costs increased $8.5 million from $67.4 million in 2023 to $75.8 million in 2024. Depreciation and amortization increased $2.2 million, primarily due to additional fixed assets purchased or acquired in our recent business acquisitions and the launch of Cryoportal® 2 Logistics Management Platform in May 2023, an increase of $1.8 million as a result of cost alignment and reprioritization initiatives and an increase of $0.5 million in public company related expenses (including legal, audit and internal control audit fees). These increases were partially offset by a decrease of $6.0 million in integration and acquisition costs primarily as a result of actively exploring a strategic business opportunity in 2023 that did not occur in 2024, a decrease of $2.7 million in stock compensation expense, and a decrease of $2.2 million related to the change in contingent consideration.
Engineering and development expenses. Engineering and development expenses decreased by $0.3 million, or 1.8%, for the year ended December 31, 2024, as compared to the same period in 2023. The decrease was primarily due to a decrease of $0.5 million in dues and subscription, a decrease of $0.5 million in development costs, consulting and prototype expenses and a decrease of $0.3 million in stock compensation expense. These decreases were partially offset by an increase of $1.1 million in wages and associated employee costs to add software development and engineering resources. We continually strive to improve and expand the features of our Cryoport Express®, Cryoport ELITE™ Solutions and portfolio of temperature-controlled services and products, such as the recently introduced Cryoport Express® Cryogenic HV3 Shipping System. Our primary developments are directed towards facilitating the safe, reliable and efficient transport and storage of life science commodities through innovative and technology-based solutions. This includes significantly enhancing our Cryoportal® Logistics Management Platform and related technology solutions as well as developments to expand our Cryoport Express® and shipper fleets. In addition, engineering and development efforts are also focused on MVE Biological Solutions’ portfolio of advanced cryogenic stainless-steel freezers, aluminum dewars and related ancillary equipment used in the storage and transport of life sciences commodities. We supplement our internal engineering and development resources with subject matter experts and consultants to enhance our capabilities and shorten development cycles.
43
Impairment loss. As a result of the interim impairment assessment performed as of June 30, 2024, the Company recorded an impairment loss of $63.8 million, primarily related to full impairment charge of goodwill related to the MVE Biological Solutions reporting unit.
Investment Income. Investment income decreased by $0.7 million, for the year ended December 31, 2024, as compared to the prior year.
Interest expense. Interest expense decreased by $1.4 million, from $5.5 million to $4.1 million for the year ended December 31, 2024, as compared to the prior year due to a decrease in interest on the convertible senior notes and amortization of the related debt discount as a result of the repurchase of the 2026 Convertible Senior Notes in 2024.
Gain on extinguishment of debt. During the year ended December 31, 2024, the Company repurchased $185.0 million in aggregate principal amount of the 2026 Convertible Senior Notes for a repurchase price of $163.1 million in cash, plus accrued and unpaid interest, resulting in a net gain of $18.5 million, which includes the write off of $2.7 million of unamortized debt issuance costs and $0.7 million of transaction costs.
Other income (expense), net. The decrease in other income (expense), net for the year ended December 31, 2024, as compared to the prior year is primarily due to an increase of $6.3 million in short-term investment net unrealized loss, a decrease of $2.7 million for currency revaluation, a decrease in the gain on insurance claim of $2.6 million in 2023 related to the New Prague fire that did not occur in the current year and a decrease of $0.5 million for foreign currency due to current period losses.
Provision for income taxes. The provision for income taxes increased by $1.0 million for the year ended December 31, 2024, as compared to the same period in the prior year, resulting in effective tax rates of negative 1.1% and negative 0.2%, respectively. The increase in tax expense and the decrease in the effective tax rate for the year ended December 31, 2024, as compared to the prior year is due to changes in the valuation allowances on our foreign operations, a tax benefit from the reduction of the deferred tax liability on indefinite-lived intangible assets related to the impairment and an increase in our domestic losses which resulted in no additional tax benefit. The effective tax rate of negative 1.1% for the year ended December 31, 2024, differed from the U.S. federal statutory rate of 21% primarily due to changes in the valuation allowance that we maintain against our deferred tax assets, the impairment of goodwill and the relative mix of income earned by certain foreign subsidiaries being taxed at different rates than the U.S. federal statuary rate.
Paid-in-kind dividend on Series C convertible preferred stock. The paid-in-kind dividend relates to the private placement of Series C Preferred Stock with Blackstone.
Business segment results
Life Sciences Services
Life Sciences Services revenue increased from $149.9 million to $163.7 million for the year ended December 31, 2024, as compared to the same period in 2023. Adjusted EBITDA increased from ($14.6) million to ($10.4) million for the year ended December 31, 2024, as compared to the same period in 2023. Refer to the discussion of Life Sciences Services revenue in the Results of Operations section above for discussion of the key drivers of revenues from this segment. Segment expenses were higher due to increased cost of revenues from increased sales and an increase in employee related expenses of $10.7 million. These increases were partially offset by a decrease in other segment items of $2.7 million and a decrease in engineering and development expenses of $1.0 million.
Life Sciences Products
Life Sciences Products revenue decreased from $89.0 million to $72.0 million for the year ended December 31, 2024, as compared to the same period in 2023 as a result of decreased demand for cryogenic systems. Adjusted EBITDA decreased from $20.2 million to $12.7 million for the year ended December 31, 2024, as compared to the same period in 2023. Refer to the discussion of Life Sciences Products revenue in the Results of Operations section above for discussion of the key drivers of revenues from this segment which are exclusively Life Sciences Products. Segment expenses were lower due to decreased cost of revenues from decreased sales volume and lower employee related expenses of $1.9 million due to cost reduction measures. See Note 20 in the accompanying consolidated financial statements.
44
Non-GAAP Financial Measures
We provide adjusted EBITDA and revenue at constant currency, both non-GAAP financial measures, as supplemental measures to U.S. GAAP measures regarding our operating performance. Non-GAAP financial measures are not calculated in accordance with U.S. GAAP, are not based on any comprehensive set of accounting rules or principles and may be different from non-GAAP financial measures presented by other companies. Non-GAAP financial measures, including adjusted EBITDA and revenue at constant currency, should not be considered as a substitute for, or superior to, measures of financial performance prepared in accordance with U.S. GAAP.
Adjusted EBITDA
Adjusted EBITDA is defined as net loss adjusted for interest expense, income taxes, depreciation and amortization expense, stock-based compensation expense, acquisition and integration costs, cost reduction initiatives, investment income, unrealized gain or loss on investments, foreign currency gain or loss, net gain on insurance claim, gain on extinguishment of debt, impairment loss, changes in fair value of contingent consideration and charges or gains resulting from non-recurring events, as applicable.
Management believes adjusted EBITDA provides a useful measure of our operating results, a meaningful comparison with historical results and with the results of other companies, and insight into our ongoing operating performance. Further, management and our board of directors utilize adjusted EBITDA to gain a better understanding of our comparative operating performance from period-to-period and as a basis for planning and forecasting future periods. Adjusted EBITDA is also a significant performance measure used by us in connection with our incentive compensation programs. Management believes adjusted EBITDA, when read in conjunction with our U.S. GAAP financials, is useful to investors because it provides a basis for meaningful period-to-period comparisons of our ongoing operating results, including results of operations, against investor and analyst financial models, identifying trends in our underlying business and performing related trend analyses, and it provides a better understanding of how management plans and measures our underlying business.
A reconciliation of adjusted EBITDA to net loss, the most directly comparable U.S. GAAP financial measure, is presented below.
Cryoport, Inc. and Subsidiaries
Adjusted EBITDA Reconciliation
(Unaudited, in thousands)
Three Months Ended |
Year Ended |
|||||||||||
December 31, |
December 31, |
|||||||||||
|
2024 |
|
2023 |
|
2024 |
|
2023 |
|||||
GAAP net loss |
|
$ |
(18,677) |
|
$ |
(62,389) |
|
$ |
(114,756) |
$ |
(99,587) |
|
Non-GAAP adjustments to net loss: |
|
|
|
|
|
|
||||||
Depreciation and amortization expense |
|
7,894 |
|
7,449 |
|
30,757 |
|
27,487 |
||||
Acquisition and integration costs |
|
3 |
|
641 |
|
899 |
|
6,945 |
||||
Cost reduction initiatives |
768 |
— |
1,884 |
— |
||||||||
Investment income |
|
(1,427) |
|
(2,615) |
|
(9,895) |
|
(10,577) |
||||
Unrealized (gain)/loss on investments |
|
2,445 |
|
(3,542) |
|
5,038 |
|
(1,242) |
||||
Gain on insurance claim |
|
— |
|
— |
|
— |
|
(2,642) |
||||
Foreign currency (gain)/loss |
|
3,172 |
|
(1,078) |
|
2,410 |
|
(964) |
||||
Interest expense, net |
636 |
1,306 |
4,108 |
5,503 |
||||||||
Stock-based compensation expense |
|
4,413 |
|
5,848 |
|
19,704 |
|
22,808 |
||||
Gain on extinguishment of debt, net |
— |
— |
(18,505) |
(5,679) |
||||||||
Impairment loss |
— |
49,569 |
63,809 |
49,569 |
||||||||
Change in fair value of contingent consideration |
(518) |
(665) |
(1,847) |
(601) |
||||||||
Other non-recurring costs |
— |
187 |
— |
437 |
||||||||
Income taxes |
29 |
(1,359) |
|
1,276 |
239 |
|||||||
Adjusted EBITDA |
(1,262) |
(6,648) |
(15,118) |
(8,304) |
||||||||
45
Revenue at Constant Currency
We believe that revenue growth is a key indicator of how our Company is progressing from period to period and we believe that the non-GAAP financial measure “revenue at constant currency” is useful to investors in analyzing the underlying trends in revenue. Under U.S. GAAP, revenue received in local (non-U.S. dollar) currency is translated into U.S. dollars at the average exchange rate for the period presented. As a result, fluctuations in foreign currency exchange rates affect the results of our operations and the value of our foreign assets and liabilities, which in turn may adversely affect results of operations and cash flows and the comparability of period-to-period results of operations. When we use the term “constant currency,” it means that we have translated local currency revenue for the current reporting period into U.S. dollars using the same average foreign currency exchange rates for the conversion of revenue into U.S. dollars that we used to translate local currency revenue for the comparable reporting period of the prior year.
Changes in foreign currency exchange rates had an unfavorable impact on our results of operations and cash flow from our operations in EMEA and APAC during the year ended December 31, 2024. Our revenue would have been $0.3 million higher in constant currency for the year ended December 31, 2024.
However, we also believe that data on constant currency period-over-period changes have limitations, particularly as the currency effects that are eliminated could constitute a significant element of our revenue and could significantly impact our performance. We therefore limit our use of constant currency period-over-period changes to a measure for the impact of currency fluctuations on the translation of local currency revenue into U.S. dollars. We do not evaluate our results and performance without considering both period-over-period changes in non-GAAP constant currency revenue on the one hand and changes in revenue prepared in accordance with U.S. GAAP on the other. We caution the readers of this report to follow a similar approach by considering revenue on constant currency period-over-period changes only in addition to, and not as a substitute for, or superior to, changes in revenue prepared in accordance with U.S. GAAP.
Cryoport, Inc. and Subsidiaries
Revenues by Market at Constant Currency
(Unaudited, in thousands)
Year Ended December 31, 2024 |
|
|||||||||
Life Sciences |
Life Sciences |
|
||||||||
|
Services |
|
Products |
|
Total |
|||||
As Reported |
$ |
153,660 |
$ |
74,725 |
$ |
228,385 |
||||
Non-GAAP Constant Currency |
|
153,879 |
|
74,807 |
|
228,685 |
||||
FX Impact [$] |
$ |
(219) |
$ |
(82) |
$ |
(300) |
||||
FX Impact [%] |
|
(0.1) |
% |
|
(0.1) |
% |
|
(0.1) |
% |
|
Liquidity and Capital Resources
As of December 31, 2024, the Company had cash and cash equivalents of $45.3 million, short-term investments of $216.5 million and working capital of $277.0 million. We expect to continue to incur significant expenses for the foreseeable future and to incur operating losses in the near term while we make investments in new supply chain initiatives, geographic expansion and technology to support our anticipated growth. Historically, we have financed our operations primarily through sales of equity securities and debt instruments.
The Company’s management recognizes that the Company may need to obtain additional capital to fund its operations and potential acquisitions until sustained profitable operations are achieved. Additional funding plans may include obtaining additional capital through equity and/or debt funding sources. No assurance can be given that additional capital, if needed, will be available when required or upon terms acceptable to the Company. The Company’s management believes that, based on its current plans and assumptions, the current cash and cash equivalents on hand, short-term investments, together with projected cash flows, will satisfy our operational and capital requirements for at least the next twelve months.
46
Cash flows Summary
For the Year Ended December 31, |
|||||||||
|
2024 |
|
2023 |
|
$ Change |
||||
(in thousands) |
|||||||||
Operating activities |
$ |
(16,323) |
$ |
(757) |
$ |
(15,566) |
|||
Investing activities |
|
176,815 |
|
36,045 |
|
140,770 |
|||
Financing activities |
|
(161,531) |
|
(23,798) |
|
(137,733) |
|||
Effect of exchange rate changes on cash and cash equivalents |
|
(18) |
|
(1,739) |
|
1,721 |
|||
Net increase (decrease) in cash and cash equivalents |
$ |
(1,057) |
$ |
9,751 |
$ |
(10,808) |
|||
Operating activities
For the year ended December 31, 2024, our operating acitivities used $16.3 million of cash, reflecting the net loss of $114.8 million offset by non-cash expenses of $107.0 million primarily comprised of $63.8 million of impairment loss, $30.8 million of depreciation and amortization, $19.7 million of stock-based compensation, $5.8 million of non-cash operating lease expense, which was partially offset by a gain on the extinguishment of debt of $18.5 million. Also contributing to the cash impact of our net operating loss, excluding non-cash items, was a decrease in operating lease liabilities of $5.3 million, an increase in accounts receivable of $4.1 million, an increase in prepaid expenses and other current assets of $2.1 million, a decrease in accounts payable and other accrued expenses of $0.1 million, an increase in deposits of $1.4 million and a decrease in net deferred tax liability of $0.4 million, which were partially offset by a decrease in inventories of $3.3 million, and an increase in accrued compensation and related expenses of $1.9 million.
Investing activities
Net cash provided by investing activities of $176.8 million during the year ended December 31, 2024 was primarily due to the $249.1 million maturity of short-term investments. These proceeds were partially offset by the purchase of short-term investments of $50.7 million, and facility expansions (including leasehold improvements, furniture and equipment) and additional purchases of Cryoport Express® Shippers, Smart Pak IITM Condition Monitoring Systems, freezers and computer equipment for $17.3 million.
Financing Activity
Net cash used in financing activities totaled $161.5 million during the year ended December 31, 2024, primarily as a result of $163.8 million paid for the repurchase 2026 Convertible Senior Notes, partially offset by proceeds of $2.8 million from the exercise of stock options.
47
Repurchase Program
In March 2022, Company’s Board of Directors authorized a repurchase program through December 31, 2025, authorizing the repurchase of common stock and/or convertible senior notes in the amount of up to $100.0 million from time to time, on the open market or otherwise, in such quantities, at such prices, and in such manner as determined by the Company’s management at its discretion (the “2022 Repurchase Program”). The size and timing repurchases under the 2022 Repurchase Program were dependant on a number of factors, including the market price of the Company’s common stock, general market and economic conditions, and applicable legal requirements.
In July 2024, May 2024 and September 2023, the Company repurchased $15.0 million, $10.0 million and $31.3 million, respectively, in aggregate principal amount of the 2026 Convertible Senior Notes for a repurchase price of $12.9 million, $8.7 million and $25.0 million, respectively, in cash under the 2022 Repurchase Program.
In August 2024, the Company’s Board of Directors authorized a Repurchase Program through December 31, 2027, authorizing the repurchase of common stock and/or convertible senior notes in the amount of up to $200.0 million from time to time, on the open market or otherwise, in such quantities, at such prices, and in such manner as determined by the Company’s management at its discretion (the “2024 Repurchase Program” and, together with the 2022 Repurchase Program, the “Repurchase Programs”). The size and timing of any repurchase under the 2024 Repurchase Programs will depend on a number of factors, including the market price of the Company’s common stock, general market and economic conditions, and applicable legal requirements.
Also in August 2024, the Company repurchased approximately $160.0 million aggregate principal amount of the 2026 Convertible Senior Notes for a repurchase price of $141.6 million, plus accrued and unpaid interest under the 2024 Repurchase Programs. As of December 31, 2024, the Company has approximately $73.9 million of repurchase authorization available under the 2024 Repurchase Programs.
There were no shares repurchased during the years ended December 31, 2024 and 2023.
As of December 31, 2024, the Company has approximately $200.5 million aggregate principal amount of the 2025 Senior Notes and 2026 Senior Notes outstanding and has approximately $73.9 million of repurchase authorization available under the Repurchase Programs. For additional information about the Convertible Senior Notes, see Note 12 in our accompanying consolidated financial statements.
Item 7A. Quantitative and Qualitative Disclosures About Market Risk
We are exposed to market risk for the effect of interest rate changes, foreign currency fluctuations, and changes in the market values of our investments.
Interest Rate Risk
Our exposure to market risk for changes in interest rates relates primarily to our investment portfolio and our long-term debt. Our long-term debt is carried at amortized cost and fluctuations in interest rates do not impact our consolidated financial statements. However, the fair value of our debt, which pays interest at a fixed rate, will generally fluctuate with movements of interest rates, increasing when interest rates are declining and declining when interest rates are increasing. We invest our excess cash in high investment grade money market funds and investment grade short to intermediate-term fixed income securities. Fixed income securities may have their fair market value adversely affected due to a rise in interest rates, and we may suffer losses if forced to sell securities that have declined in market value due to changes in interest rates. As of December 31, 2024, the estimated fair value of the Convertible Senior Notes was $178.7 million. For additional information about the Convertible Senior Notes, see Note 12 in our accompanying consolidated financial statements.
Foreign Exchange Risk
We operate in the United States and other foreign countries, which creates exposure to foreign currency exchange fluctuations. Net sales and related expenses generated from our international business are primarily denominated in the functional currencies of the corresponding subsidiaries and primarily include Euros, British Pounds, Chinese Yuan, and Indian Rupee. The results of operations of, and certain of our intercompany balances associated with, our internationally focused business are exposed to foreign exchange rate
48
fluctuations. Upon consolidation, as foreign exchange rates vary, revenues and other operating results may differ materially from expectations and we may record material gain or losses on the remeasurement of intercompany balances. For example, for the year ended December 31, 2024, revenues from our international business, which accounted for 38.2% of our consolidated revenues, decreased by $0.3 million in comparison with the same period in the prior year as a result of fluctuations in foreign exchange rates. The impact of fluctuations in foreign exchange rates is derived by applying the average currency rates for the same period of the prior year to the current period revenues.
We have foreign exchange risk related to foreign-denominated cash and cash equivalents. Based on the foreign-dominated cash balance as of December 31, 2024, of $30.6 million, an assumed 5%, 10%, and 20% adverse change to foreign exchange would result in declines of $1.5 million, $3.1 million, and $6.1 million, respectively, recorded to “Accumulated other comprehensive income (loss)”, a separate component of stockholders’ equity.
We have foreign exchange risk related to our long and short-term foreign-denominated intercompany loan balances. Based on the long-term intercompany loan balances as of December 31, 2024, an assumed 5%, 10%, and 20% adverse change to foreign exchange would result in losses of $4.6 million, $9.1 million, and $18.2 million, respectively, recorded to “Accumulated other comprehensive income (loss)”. Based on the short-term intercompany loan balances as of December 31, 2024, an assumed 5%, 10%, and 20% adverse change to foreign exchange would result in losses of $1.0 million, $1.9 million, and $3.8 million, respectively, reported as “Other income (expense), net”.
Item 8. Financial Statements and Supplementary Data
Our annual consolidated financial statements are included in Part IV, Item 15 of this Form 10-K and are incorporated into this Item 8 by reference.
Item 9. Changes in and Disagreements with Accountants on Accounting and Financial Disclosure
None.
Item 9A. Controls and Procedures
(a) Evaluation of Disclosure Controls and Procedures
The term “disclosure controls and procedures” (as defined in Rule 13a-15(e) and 15d-15(e) under the Exchange Act) refers to the controls and other procedures of a company that are designed to ensure that information required to be disclosed by a company in the reports that it files or submits under the Exchange Act is recorded, processed, summarized and reported within the time periods specified in the SEC’s rules and forms. Disclosure controls and procedures include, without limitation, controls and procedures designed to ensure that information required to be disclosed by a company in the reports that it files or submits under the Exchange Act is accumulated and communicated to the company’s management, including its principal executive and principal financial officers, or persons performing similar functions, as appropriate to allow timely decisions regarding required disclosure. Under the supervision and with the participation of our management, including our Chief Executive Officer and Chief Financial Officer, we have conducted an evaluation of the effectiveness of the design and operation of our disclosure controls and procedures as of December 31, 2024. Based on this evaluation, our Chief Executive Officer and Chief Financial Officer concluded that our disclosure controls and procedures were effective as of December 31, 2024.
(b) Management’s Report on Internal Control Over Financial Reporting.
Management’s Report on Internal Control Over Financial Reporting which appears on the following page is incorporated herein by reference.
Deloitte & Touche LLP, an independent registered public accounting firm, has audited the effectiveness of our internal control over financial reporting (as defined in Rule 13a-15(f) and 15d-15(f) under the Exchange Act) as of December 31, 2024, as stated in its attestation report included in Part II, Item 8. “Financial Statements and Supplementary Data” included elsewhere in this Form 10-K.
49
(c) Changes In Internal Control Over Financial Reporting
During the quarter ended December 31, 2023, there were no changes in our internal control over financial reporting that have materially affected, or are reasonably likely to materially affect, our internal control over financial reporting.
Item 9B. Other Information
Insider Trading Arrangements and Policies
On
Item 9C. Disclosure Regarding Foreign Jurisdictions that Prevent Inspections
Not applicable.
50
CRYOPORT, INC.
MANAGEMENT’S REPORT ON
INTERNAL CONTROL OVER FINANCIAL REPORTING
The management of the Company is responsible for establishing and maintaining effective internal control over financial reporting and for the assessment of the effectiveness of internal control over financial reporting. The Company’s internal control over financial reporting is a process designed to provide reasonable assurance regarding the reliability of financial reporting and the preparation of consolidated financial statements for external purposes in accordance with accounting principles generally accepted in the United States of America.
The Company’s internal control over financial reporting is supported by written policies and procedures that:
| ● | pertain to the maintenance of records that, in reasonable detail, accurately and fairly reflect the transactions and dispositions of the Company’s assets; |
| ● | provide reasonable assurance that transactions are recorded as necessary to permit preparation of consolidated financial statements in accordance with accounting principles generally accepted in the United States of America, and that receipts and expenditures of the Company are being made only in accordance with authorizations of the Company’s management and directors; and |
| ● | provide reasonable assurance regarding prevention or timely detection of unauthorized acquisition, use or disposition of the Company’s assets that could have a material effect on the consolidated financial statements. |
Because of its inherent limitations, internal control over financial reporting may not prevent or detect misstatements. Projections of any evaluation of effectiveness to future periods are subject to the risk that controls may become inadequate because of changes in conditions, or that the degree of compliance with the policies or procedures may deteriorate.
In connection with the preparation of the Company’s annual consolidated financial statements, management of the Company has undertaken an assessment of the effectiveness of the Company’s internal control over financial reporting based on criteria established in Internal Control — Integrated Framework (2013) issued by the Committee of Sponsoring Organizations of the Treadway Commission. Management’s assessment included an evaluation of the design of the Company’s internal control over financial reporting and testing of the operational effectiveness of the Company’s internal control over financial reporting.
Based on this assessment, management has concluded that the Company’s internal control over financial reporting was effective as of December 31, 2024.
By: |
/s/ JERRELL W. SHELTON |
|
|
Jerrell W. Shelton, |
|
|
President and Chief Executive Officer |
|
By: |
/s/ ROBERT STEFANOVICH |
|
|
Robert Stefanovich, |
|
|
Chief Financial Officer |
|
March 7, 2025
51
PART III
A list of our executive officers and their respective biographical information appears in Part I, Item 1 of this Form 10-K.
We have adopted a corporate code of conduct that applies to our directors and all employees, including our Chief Executive Officer and Chief Financial Officer. We have posted the text of our corporate code of conduct on our website at www.cryoportinc.com.
on the “Investor Relations: Governance” page under the heading “Governance Documents.” We intend to satisfy the requirement under Item 5.05 of Form 8-K regarding disclosure of amendments to, or waivers from, provisions of our corporate code of conduct by posting such information on our website.
The other information required under this item is incorporated by reference from our definitive proxy statement related to our 2025 Annual Meeting of Stockholders, or the Proxy Statement, to be filed with the SEC within 120 days of our fiscal year ended December 31, 2024.
Item 11. Executive Compensation
The information required by this item can be found in our Proxy Statement and is incorporated herein by reference.
Item 12. Security Ownership of Certain Beneficial Owners and Management and Related Stockholder Matters
The information required by this item can be found in our Proxy Statement and is incorporated herein by reference.
Item 13. Certain Relationships and Related Transactions, and Director Independence
The information required by this item can be found in our Proxy Statement and is incorporated herein by reference.
Item 14. Principal Accountant Fees and Services
The information required by this item can be found in our Proxy Statement and is incorporated herein by reference.
52
PART IV
Item 15. Exhibits and Financial Statement Schedules
(a)(1) Consolidated Financial Statements:
(a)(2) Financial Statement Schedules: All financial statement schedules are omitted because they are not applicable or the required information is included in the Consolidated Financial Statements or notes thereto.
(a)(3) Exhibits.
53
54
Exhibit No. |
|
Description |
|
|---|---|---|---|
4.4 |
|||
4.5 |
|||
10.1* |
|||
|
|
||
10.2* |
|||
|
|
||
10.3* |
|||
|
|
||
10.4* |
|||
|
|
||
10.5* |
|||
|
|
||
10.6* |
|||
|
|
||
10.7* |
|||
10.8* |
|||
|
|
||
10.9* |
Amended and Restated Employment Agreement dated February 15, 2024 between the Company and Robert S. Stefanovich. Incorporated by reference to Exhibit 10.2 of the Company’s Current Report on Form 8-K dated February 15, 2024. |
||
10.10* |
|||
|
|
||
10.11*+ |
|||
10.12 |
|||
|
|
||
10.13 |
|||
|
|||
10.14˄ |
|||
|
|||
10.15 |
|||
|
|||
10.16 |
|||
55
Exhibit No. |
|
Description |
|
|---|---|---|---|
10.17+ |
Form of Stock Option Agreement Issued by Cryoport, Inc. to certain employees on May 7, 2015. |
||
|
|
||
16.1 |
|||
19+ |
|||
21+ |
|||
|
|
||
23.1+ |
Consent of Ernst & Young LLP, Independent Registered Public Accounting Firm. |
||
23.2+ |
Consent of Deloitte & Touche LLP, Independent Registered Public Accounting Firm. |
||
|
|
||
31.1+ |
|||
|
|
||
31.2+ |
|||
32.1+ |
|||
|
|
||
32.2+ |
|||
|
|
||
97 |
|||
101.INS+ |
Inline XBRL Instance Document - the instance document does not appear in the Interactive Data File because its XBRL tags are embedded within the Inline XBRL document. |
||
|
|
||
101.SCH+ |
Inline XBRL Taxonomy Extension Schema Document. |
||
|
|
||
101.CAL+ |
Inline XBRL Taxonomy Extension Calculation Linkbase Document. |
||
|
|
||
101.DEF+ |
Inline XBRL Taxonomy Extension Definition Linkbase Document. |
||
|
|
||
101.LAB+ |
Inline XBRL Taxonomy Extension Label Linkbase Document. |
||
|
|
||
101.PRE+ |
Inline XBRL Taxonomy Extension Presentation Linkbase Document. |
||
|
|||
104 |
Cover Page Interactive Data File (formatted as Inline XBRL and contained in Exhibit 101). |
˄Certain exhibits and schedules have been omitted pursuant to Item 601(b)(2) or Item 601(a)(5) of Regulation S-K. The Company hereby undertakes to furnish copies of such omitted materials supplementally upon request by the SEC.
* |
Indicates a management contract or compensatory plan or arrangement. |
+ |
Filed or furnished herewith. |
Item 16. Form 10-K Summary
None.
56
SIGNATURES
Pursuant to the requirements of Section 13 or 15(d) of the Securities Exchange Act of 1934, the registrant has duly caused this Annual Report on Form 10-K to be signed on its behalf by the undersigned, thereunto duly authorized.
|
Cryoport, Inc. |
|
|
|
|
|
By: |
/s/ JERRELL W. SHELTON |
|
|
Jerrell W. Shelton |
|
|
President and Chief Executive Officer |
Date: March 7, 2025
Pursuant to the requirements of the Securities Exchange Act of 1934, this Annual Report on Form 10-K has been signed below by the following persons on behalf of the registrant and in the capacities and on the dates indicated:
Signature |
|
Title |
|
Date |
|
|
|
|
|||
/s/ JERRELL W. SHELTON |
President, Chief Executive Officer and Director |
March 7, 2025 |
|||
Jerrell W. Shelton |
(Principal Executive Officer) |
||||
|
|
||||
/s/ ROBERT S. STEFANOVICH |
Chief Financial Officer |
March 7, 2025 |
|||
Robert S. Stefanovich |
(Principal Financial and Accounting Officer) |
||||
/s/ DANIEL M. HANCOCK |
Director |
March 7, 2025 |
|||
Daniel M. Hancock |
|
||||
|
|
||||
/s/ ROBERT HARIRI, M.D., PH.D. |
Director |
March 7, 2025 |
|||
Robert Hariri, M.D., Ph.D. |
|
||||
|
|
||||
/s/ RAMKUMAR MANDALAM, PH.D. |
Director |
March 7, 2025 |
|||
Ramkumar Mandalam, Ph.D. |
|
||||
|
|||||
/s/ RAM JAGANNATH |
Director |
March 7, 2025 |
|||
Ram Jagannath |
|
||||
/s/ LINDA BADDOUR |
Director |
March 7, 2025 |
|||
Linda Baddour |
57
Cryoport, Inc. and Subsidiaries
Consolidated Financial Statements
INDEX TO FINANCIAL STATEMENTS
F-1
Report of Independent Registered Public Accounting Firm
To the Stockholders and the Board of Directors of Cryoport, Inc.
Opinion on the Financial Statements
We have audited the accompanying consolidated balance sheets of Cryoport, Inc. and subsidiaries (the "Company") as of December 31, 2024 and December 31, 2023, the related consolidated statements of operations, comprehensive loss, stockholders’ equity, and cash flows, for each of the two years in the period ended December 31, 2024, and the related notes (collectively referred to as the "financial statements"). In our opinion, the financial statements present fairly, in all material respects, the financial position of the Company as of December 31, 2024 and December 31, 2023, and the results of its operations and its cash flows for each of the two years in the period ended December 31, 2024, in conformity with accounting principles generally accepted in the United States of America.
We have also audited, in accordance with the standards of the Public Company Accounting Oversight Board (United States) (PCAOB), the Company's internal control over financial reporting as of December 31, 2024, based on criteria established in Internal Control — Integrated Framework (2013) issued by the Committee of Sponsoring Organizations of the Treadway Commission and our report dated March 7, 2025, expressed an unqualified opinion on the Company's internal control over financial reporting.
Basis for Opinion
These financial statements are the responsibility of the Company's management. Our responsibility is to express an opinion on the Company's financial statements based on our audits. We are a public accounting firm registered with the PCAOB and are required to be independent with respect to the Company in accordance with the U.S. federal securities laws and the applicable rules and regulations of the Securities and Exchange Commission and the PCAOB.
We conducted our audits in accordance with the standards of the PCAOB. Those standards require that we plan and perform the audit to obtain reasonable assurance about whether the financial statements are free of material misstatement, whether due to error or fraud. Our audits included performing procedures to assess the risks of material misstatement of the financial statements, whether due to error or fraud, and performing procedures that respond to those risks. Such procedures included examining, on a test basis, evidence regarding the amounts and disclosures in the financial statements. Our audits also included evaluating the accounting principles used and significant estimates made by management, as well as evaluating the overall presentation of the financial statements. We believe that our audits provide a reasonable basis for our opinion.
Critical Audit Matter
The critical audit matter communicated below is a matter arising from the current-period audit of the financial statements that was communicated or required to be communicated to the audit committee and that (1) relates to accounts or disclosures that are material to the financial statements and (2) involved our especially challenging, subjective, or complex judgments. The communication of critical audit matters does not alter in any way our opinion on the financial statements, taken as a whole, and we are not, by communicating the critical audit matter below, providing a separate opinion on the critical audit matter or on the accounts or disclosures to which it relates.
Goodwill and Trademark Impairment— MVE Reporting Unit — Refer to Notes 2 and 8 to the financial statements
Critical Audit Matter Description
The Company evaluates goodwill on an annual basis in the fourth quarter or more frequently if management believes indicators of impairment exist. In this evaluation, for each reporting unit, the Company compares the fair value of the reporting unit with its carrying amount and then recognizes an impairment charge for the amount by which the carrying amount exceeds the reporting unit’s fair value up to the total amount of goodwill allocated to the reporting unit. The Company’s interim quantitative impairment test was performed using a combination of both an income and a market approach to determine the fair value of the reporting unit. In doing this, the Company was assisted by an independent third-party specialist. The income approach for goodwill utilized the estimated discounted cash flows for the reporting unit and the market approach utilized comparable peer group information. Estimates and assumptions used in the income approach included projected cash flows for the reporting unit and a discount rate determined using a weighted average cost of capital for risk factors specific to the reporting unit and other market and industry data. The other key estimates and assumptions used in the discounted cash flow method include, but are not limited to, sales growth rates terminal growth rate, EBITDA/EBITDA
F-2
margin, and the discount rate. As a result of the Company’s 2024 quantitative assessment, the Company concluded that for the MVE reporting unit, goodwill was fully impaired. The Company recorded an impairment charge of $55M for goodwill in the consolidated statement of operations for the year ended December 31, 2024.
Indefinite-lived intangible assets are comprised of trademarks and are tested for impairment annually using a relief from royalty method that relies on estimates of future revenues, royalty rates, and discount rates. If the asset is not found to be recoverable, it is written down to the estimated fair value. As a result of the Company’s 2024 quantitative assessment, they recorded a $9M impairment charge related to the partial write-off of the MVE trademark in the consolidated statement of operations for the year ended December 31, 2024.
We identified goodwill and trademark impairment for MVE as a critical audit matter because of the significant judgments made by management to estimate the fair value of this reporting unit and fair value of trademark that are affected by future market and economic conditions. This required a high degree of auditor judgment and an increased extent of effort, including the need to involve our fair value specialists, when performing audit procedures to evaluate the reasonableness of management’s estimates and assumptions related to forecasts of revenues, EBITDA margins, discount rates, royalty rate, terminal growth rate, and selection of market multiples.
How the Critical Audit Matter Was Addressed in the Audit
Our audit procedures related to the Company’s significant assumptions and estimates related to goodwill impairment for this reporting unit included the following, among others:
| ● | We tested the effectiveness of controls over management’s goodwill impairment evaluation, including those over the determination of the fair value of the related goodwill reporting unit, such as controls related to management’s selection of the sales growth rates, terminal growth rate, EBITDA/EBITDA margin, and discount rate. |
| ● | We evaluated management’s ability to accurately forecast revenues and EBITDA margins by comparing actual results to management’s historical forecasts. |
| ● | We evaluated the reasonableness of management’s revenue and EBITDA margin forecasts through inquiry of non-management personnel and by comparing the forecasts to: |
| – | Historical revenues and EBITDA margins. |
| – | Internal communications to management and the Board of Directors. |
| – | Forecasted information included in Company press releases. |
| – | Forecasted information included in analyst and industry reports for the Company and certain of its peer companies. |
| ● | With the assistance of our fair value specialists, we evaluated the reasonableness of the discount rate, terminal growth rate, valuation methodology, and market multiples by: |
| – | Testing the source information underlying the determination of the discount rates and the mathematical accuracy of the calculation. |
| – | Developing a range of independent estimates and comparing those to the discount rate selected by management. |
| – | Evaluating the market multiples by considering the selected comparable industry grouping of publicly traded companies. |
Our audit procedures related to the Company’s significant assumptions and estimates related to trademark impairment:
| ● | We tested the effectiveness of controls over management’s trademark impairment evaluation, including those over the determination of the sales growth rates, royalty rate, and discount rate. |
| ● | We evaluated the reasonableness of management’s revenue forecasts and confirmed that the revenue projections were consistent with those used in the MVE reporting unit goodwill impairment analysis. |
| ● | With the assistance of our fair value specialists, we evaluated the reasonableness of the discount rate, royalty rate, and valuation methodology by: |
| – | Testing the source information underlying the determination of the discount and royalty rates and the mathematical accuracy of the calculation. |
| – | Developing a range of independent estimates and comparing those to the discount rate and royalty rate selected by management. |
/s/
March 7, 2025
We have served as the Company's auditor since 2023.
F-3
Report of Independent Registered Public Accounting Firm
To the Stockholders and the Board of Directors of Cryoport, Inc.
Opinion on Internal Control over Financial Reporting
We have audited the internal control over financial reporting of Cryoport, Inc. and subsidiaries (the "Company") as of December 31, 2024, based on criteria established in Internal Control — Integrated Framework (2013) issued by the Committee of Sponsoring Organizations of the Treadway Commission (COSO). In our opinion, the Company maintained, in all material respects, effective internal control over financial reporting as of December 31, 2024, based on criteria established in Internal Control — Integrated Framework (2013) issued by COSO.
We have also audited, in accordance with the standards of the Public Company Accounting Oversight Board (United States) (PCAOB), the consolidated financial statements as of and for the year ended December 31, 2024 , of the Company and our report dated March 7, 2025, expressed an unqualified opinion on those financial statements.
Basis for Opinion
The Company's management is responsible for maintaining effective internal control over financial reporting and for its assessment of the effectiveness of internal control over financial reporting, included in the accompanying Management’s Report on Internal Control Over Financial Reporting. Our responsibility is to express an opinion on the Company's internal control over financial reporting based on our audit. We are a public accounting firm registered with the PCAOB and are required to be independent with respect to the Company in accordance with the U.S. federal securities laws and the applicable rules and regulations of the Securities and Exchange Commission and the PCAOB.
We conducted our audit in accordance with the standards of the PCAOB. Those standards require that we plan and perform the audit to obtain reasonable assurance about whether effective internal control over financial reporting was maintained in all material respects. Our audit included obtaining an understanding of internal control over financial reporting, assessing the risk that a material weakness exists, testing and evaluating the design and operating effectiveness of internal control based on the assessed risk, and performing such other procedures as we considered necessary in the circumstances. We believe that our audit provides a reasonable basis for our opinion.
Definition and Limitations of Internal Control over Financial Reporting
A company's internal control over financial reporting is a process designed to provide reasonable assurance regarding the reliability of financial reporting and the preparation of financial statements for external purposes in accordance with generally accepted accounting principles. A company's internal control over financial reporting includes those policies and procedures that (1) pertain to the maintenance of records that, in reasonable detail, accurately and fairly reflect the transactions and dispositions of the assets of the company; (2) provide reasonable assurance that transactions are recorded as necessary to permit preparation of financial statements in accordance with generally accepted accounting principles, and that receipts and expenditures of the company are being made only in accordance with authorizations of management and directors of the company; and (3) provide reasonable assurance regarding prevention or timely detection of unauthorized acquisition, use, or disposition of the company's assets that could have a material effect on the financial statements.
Because of its inherent limitations, internal control over financial reporting may not prevent or detect misstatements. Also, projections of any evaluation of effectiveness to future periods are subject to the risk that controls may become inadequate because of changes in conditions, or that the degree of compliance with the policies or procedures may deteriorate.
/s/
March 7, 2025
F-4
Report of Independent Registered Public Accounting Firm
To the Stockholders and the Board of Directors of Cryoport, Inc.
Opinion on the Financial Statements
We have audited the accompanying consolidated statements of operations, comprehensive loss, stockholders' equity and cash flows of Cryoport, Inc. and subsidiaries (the Company) for the year ended December 31, 2022, and the related notes (collectively referred to as the “consolidated financial statements”). In our opinion, the consolidated financial statements present fairly, in all material respects, the results of operations and cash flows of the Company for the year ended December 31, 2022, in conformity with U.S. generally accepted accounting principles.
Basis for Opinion
These financial statements are the responsibility of the Company's management. Our responsibility is to express an opinion on the Company’s financial statements based on our audit. We are a public accounting firm registered with the PCAOB and are required to be independent with respect to the Company in accordance with the U.S. federal securities laws and the applicable rules and regulations of the Securities and Exchange Commission and the PCAOB.
We conducted our audit in accordance with the standards of the PCAOB. Those standards require that we plan and perform the audit to obtain reasonable assurance about whether the financial statements are free of material misstatement, whether due to error or fraud. Our audit included performing procedures to assess the risks of material misstatement of the financial statements, whether due to error or fraud, and performing procedures that respond to those risks. Such procedures included examining, on a test basis, evidence regarding the amounts and disclosures in the financial statements. Our audit also included evaluating the accounting principles used and significant estimates made by management, as well as evaluating the overall presentation of the financial statements. We believe that our audit provides a reasonable basis for our opinion.
/s/
We served as the Company’s auditor from 2019 to 2023.
February 28, 2023
except for the Revenue Disaggregation section of Note 3 and Note 20, Segment Reporting, as to which the date is
March 7, 2025
F-5
Cryoport, Inc. and Subsidiaries
Consolidated Balance Sheets
(in thousands, except share data)
December 31, |
||||||
|
2024 |
|
2023 |
|||
ASSETS |
||||||
Current Assets: |
|
|
||||
Cash and cash equivalents |
$ |
|
$ |
|
||
Short-term investments |
|
|
|
|
||
Accounts receivable, net |
|
|
||||
Inventories |
|
|
|
|
||
Prepaid expenses and other current assets |
|
|
|
|
||
Total current assets |
|
|
|
|
||
Property and equipment, net |
|
|
|
|||
Operating lease right-of-use assets |
|
|
||||
Intangible assets, net |
|
|
|
|||
Goodwill |
|
|
||||
Deposits |
|
|
|
|||
Deferred tax assets |
|
|
||||
Total assets |
$ |
|
$ |
|
||
LIABILITIES AND STOCKHOLDERS’ EQUITY |
|
|
|
|
||
Current Liabilities: |
|
|
|
|
||
Accounts payable and other accrued expenses |
$ |
|
$ |
|
||
Accrued compensation and related expenses |
|
|
|
|||
Deferred revenue |
|
|
|
|||
Current portion of operating lease liabilities |
|
|
||||
Current portion of finance lease liabilities |
|
|
|
|||
Current portion of convertible senior notes, net of discount of $ |
|
— |
||||
Current portion of notes payable |
|
|
||||
Current portion of contingent consideration |
|
|
||||
Total current liabilities |
|
|
|
|
||
Convertible senior notes, net of current portion and discount of $ |
|
|
||||
Notes payable, net of current portion |
|
|
||||
Operating lease liabilities, net of current portion |
|
|
||||
Finance lease liabilities, net of current portion |
|
|
||||
Deferred tax liabilities |
|
|
||||
Other long-term liabilities |
|
|
||||
Contingent consideration, net of current portion |
|
|
||||
Total liabilities |
|
|
|
|
||
Commitments and contingencies |
|
|
|
|
||
Stockholders’ Equity: |
|
|
|
|
||
Preferred stock, $ |
|
|
|
|
||
Class A convertible preferred stock - $ |
|
|
||||
Class B convertible preferred stock - $ |
|
|
||||
Class C convertible preferred stock - $ |
|
|
||||
Common stock, $ |
|
|
||||
Additional paid-in capital |
|
|
|
|
||
Accumulated deficit |
|
( |
|
( |
||
Accumulated other comprehensive loss |
|
( |
|
( |
||
Total stockholders’ equity |
|
|
|
|
||
Total liabilities and stockholders’ equity |
$ |
|
$ |
|
||
See accompanying notes to consolidated financial statements.
F-6
Cryoport, Inc. and Subsidiaries
Consolidated Statements of Operations
(in thousands, except per share data)
Years Ended |
|||||||||
|
|
2024 |
|
2023 |
|
2022 |
|||
Life sciences services revenue |
$ |
|
$ |
|
$ |
|
|||
Life sciences products revenue |
|
|
|
||||||
Total revenue |
|
|
|
||||||
Cost of services revenue |
|
|
|
||||||
Cost of products revenue |
|
|
|
|
|
||||
Total cost of revenue |
|
|
|
||||||
Gross margin |
|
|
|
|
|
||||
|
|
|
|||||||
Operating costs and expenses: |
|
|
|
|
|
|
|||
Selling, general and administrative |
|
|
|
|
|
|
|||
Engineering and development |
|
|
|
|
|
|
|||
Impairment loss |
|
|
— |
||||||
Total operating costs and expenses |
|
|
|
|
|
|
|||
|
|
|
|
||||||
Loss from operations |
|
( |
|
( |
|
( |
|||
Other income (expense): |
|
|
|
|
|
|
|||
Investment income |
|
|
|
||||||
Interest expense |
|
( |
|
( |
|
( |
|||
Gain on extinguishment of debt, net |
|
|
— |
||||||
Other income (expense), net |
|
( |
|
|
|
( |
|||
Total other income (expense), net |
|
|
|
( |
|||||
Loss before provision for income taxes |
|
( |
|
( |
|
( |
|||
Provision for income taxes |
|
( |
|
( |
|
( |
|||
Net loss |
$ |
( |
$ |
( |
$ |
( |
|||
Paid-in-kind dividend on Series C convertible preferred stock |
( |
( |
( |
||||||
Net loss attributable to common stockholders |
( |
$ |
( |
$ |
( |
||||
Net loss per share - basic and diluted |
$ |
( |
$ |
( |
$ |
( |
|||
Weighted average shares outstanding – basic and diluted |
|
|
|
|
|
|
|||
See accompanying notes to consolidated financial statements.
F-7
Cryoport, Inc. and Subsidiaries
Consolidated Statements of Comprehensive Loss
(in thousands)
Years Ended December 31, |
|||||||||
|
2024 |
|
2023 |
|
2022 |
||||
Net loss |
$ |
( |
$ |
( |
$ |
( |
|||
Other comprehensive income (loss), net of tax: |
|
|
|
|
|
|
|||
Net unrealized gain on available-for-sale debt securities |
|
|
|
|
|
( |
|||
Reclassification of realized (gain) loss on available-for-sale debt securities to earnings |
|
|
( |
||||||
Foreign currency translation adjustments |
|
( |
|
( |
|
( |
|||
Other comprehensive income (loss) |
|
|
|
|
|
( |
|||
Total comprehensive loss |
$ |
( |
$ |
( |
$ |
( |
|||
See accompanying notes to consolidated financial statements.
F-8
Cryoport, Inc. and Subsidiaries
Consolidated Statements of Stockholders’ Equity
(in thousands, except share data)
Accumulated |
||||||||||||||||||||||||||||||||
Other |
||||||||||||||||||||||||||||||||
Class A |
Class B |
Class C |
Comprehensive |
Total |
||||||||||||||||||||||||||||
Preferred Stock |
Preferred Stock |
Preferred Stock |
Common Stock |
Additional |
Accumulated |
Income |
Stockholders’ |
|||||||||||||||||||||||||
|
Shares |
|
Amount |
|
Shares |
|
Amount |
|
Shares |
|
Amount |
|
Shares |
|
Amount |
|
Paid–In Capital |
|
Deficit |
|
(Loss) |
|
Equity (Deficit) |
|||||||||
|
|
|
|
|
|
|
|
|
|
|||||||||||||||||||||||
Balance at December 31, 2021 |
|
— |
$ |
— |
|
— |
$ |
— |
|
$ |
|
|
|
$ |
|
$ |
|
$ |
( |
$ |
( |
$ |
|
|||||||||
Net loss |
|
— |
|
— |
|
— |
|
— |
— |
— |
|
— |
|
— |
|
— |
|
( |
|
— |
|
( |
||||||||||
Other comprehensive loss, net of taxes |
|
— |
|
— |
|
— |
|
— |
— |
— |
|
— |
|
— |
|
— |
|
— |
|
( |
|
( |
||||||||||
Stock-based compensation expense |
|
— |
|
— |
|
— |
|
— |
— |
— |
|
— |
|
— |
|
|
|
— |
|
— |
|
|
||||||||||
Paid-in-kind preferred stock dividend |
|
— |
|
— |
|
— |
|
— |
— |
|
|
— |
|
— |
|
( |
|
— |
|
— |
|
— |
||||||||||
Issuance of common stock for Cell&Co acquisition |
|
— |
|
— |
|
— |
|
— |
— |
— |
|
|
|
— |
|
|
|
— |
|
— |
|
|
||||||||||
Repurchase of common stock |
|
— |
|
— |
|
— |
|
— |
— |
— |
|
( |
|
( |
|
— |
|
( |
|
— |
|
( |
||||||||||
Vesting of restricted stock units |
|
— |
|
— |
|
— |
|
— |
— |
— |
|
|
|
— |
|
— |
|
— |
|
— |
|
— |
||||||||||
Proceeds from exercise of stock options |
|
— |
|
— |
|
— |
|
— |
— |
— |
|
|
|
— |
|
|
|
— |
|
— |
|
|
||||||||||
Balance at December 31, 2022 |
|
— |
$ |
— |
|
— |
$ |
— |
|
$ |
|
|
|
$ |
|
$ |
|
$ |
( |
$ |
( |
$ |
|
|||||||||
Net loss |
|
— |
|
— |
|
— |
|
— |
— |
— |
|
— |
|
— |
|
— |
|
( |
|
— |
|
( |
||||||||||
Other comprehensive income, net of taxes |
|
— |
|
— |
|
— |
|
— |
— |
— |
|
— |
|
— |
|
— |
|
— |
|
|
|
|
||||||||||
Stock-based compensation expense |
|
— |
|
— |
|
— |
|
— |
— |
— |
|
— |
|
— |
|
|
|
— |
|
— |
|
|
||||||||||
Paid-in-kind preferred stock dividend |
|
— |
|
— |
|
— |
|
— |
— |
|
|
— |
|
— |
|
( |
|
— |
|
— |
|
— |
||||||||||
Vesting of restricted stock units |
|
— |
|
— |
|
— |
|
— |
— |
— |
|
|
|
— |
|
— |
|
— |
|
— |
|
— |
||||||||||
Proceeds from exercise of stock options |
|
— |
|
— |
|
— |
|
— |
— |
— |
|
|
|
|
|
|
|
— |
|
— |
|
|
||||||||||
Balance at December 31, 2023 |
|
— |
$ |
— |
|
— |
$ |
— |
|
$ |
|
|
|
$ |
|
$ |
|
$ |
( |
$ |
( |
$ |
|
|||||||||
Net loss |
|
— |
|
— |
|
— |
|
— |
— |
— |
|
— |
|
— |
|
— |
|
( |
|
— |
|
( |
||||||||||
Other comprehensive loss, net of taxes |
|
— |
|
— |
|
— |
|
— |
— |
— |
|
— |
|
— |
|
— |
|
— |
|
|
|
|
||||||||||
Stock-based compensation expense |
|
— |
|
— |
|
— |
|
— |
— |
— |
|
— |
|
— |
|
|
|
— |
|
— |
|
|
||||||||||
Paid-in-kind preferred stock dividend |
— |
— |
— |
— |
— |
|
— |
— |
( |
— |
— |
— |
||||||||||||||||||||
Vesting of restricted stock units |
|
— |
|
— |
|
— |
|
— |
— |
— |
|
|
|
— |
|
— |
|
— |
|
— |
|
— |
||||||||||
Proceeds from exercise of stock options |
— |
|
— |
|
— |
|
— |
— |
— |
|
|
|
|
|
|
|
— |
|
— |
|
|
|||||||||||
Balance at December 31, 2024 |
— |
$ |
— |
|
— |
$ |
— |
|
$ |
|
|
|
$ |
|
$ |
|
$ |
( |
$ |
( |
$ |
|
||||||||||
See accompanying notes to consolidated financial statements.
F-9
Cryoport, Inc. and Subsidiaries
Consolidated Statements of Cash Flows
(in thousands)
|
||||||||||
Years Ended December 31, |
||||||||||
|
2024 |
|
2023 |
|
2022 |
|
||||
Cash Flows From Operating Activities: |
|
|
|
|
|
|
||||
Net loss |
$ |
( |
$ |
( |
$ |
( |
||||
Adjustments to reconcile net loss to net cash used in operating activities: |
|
|
|
|
|
|
||||
Impairment loss |
|
|
— |
|||||||
Depreciation and amortization |
|
|
|
|
|
|
||||
Amortization of debt discount |
|
|
|
|
|
|
||||
Non-cash operating lease expense |
|
|
|
|||||||
Unrealized (gain) loss on investments in equity securities |
|
|
|
( |
|
|
||||
Realized loss on investments in equity securities |
|
|
|
— |
|
— |
||||
Realized loss on available-for-sale investments |
|
|
|
|||||||
Gain on extinguishment of debt |
( |
( |
— |
|||||||
Stock-based compensation expense |
|
|
|
|
|
|
||||
Loss on disposal of property and equipment |
|
|
|
|
|
|
||||
Gain on insurance settlement |
— |
( |
( |
|||||||
Change in credit losses |
( |
|
|
|||||||
Excess and obsolete inventory |
|
— |
|
|||||||
Insurance proceeds for operations |
— |
|
|
|||||||
Change in contingent consideration |
( |
( |
|
|||||||
Changes in operating assets and liabilities: |
||||||||||
Accounts receivable |
|
( |
|
|
|
( |
||||
Inventories |
|
|
|
|
|
( |
||||
Prepaid expenses and other current assets |
|
( |
|
( |
|
( |
||||
Deposits |
|
( |
|
( |
|
( |
||||
Operating lease liabilities |
( |
( |
( |
|||||||
Accounts payable and other accrued expenses |
|
( |
|
( |
|
( |
||||
Accrued compensation and related expenses |
|
|
|
|
|
( |
||||
Deferred revenue |
|
( |
|
|
|
( |
||||
Net deferred tax liability |
( |
( |
( |
|||||||
Net cash used in operating activities |
|
( |
|
( |
|
( |
||||
|
|
|
|
|||||||
Cash Flows From Investing Activities: |
|
|
|
|
||||||
Purchases of property and equipment |
|
( |
|
( |
|
( |
||||
Insurance proceeds for loss of fixed assets |
— |
|
|
|||||||
Software development costs |
( |
( |
( |
|||||||
Purchases of short-term investments |
( |
( |
( |
|||||||
Cash paid for acquisitions |
( |
( |
( |
|||||||
Sales/maturities of short-term investments |
|
|
|
|
|
|
||||
Patent and trademark costs |
( |
( |
( |
|||||||
Net cash provided by (used in) investing activities |
|
|
|
|
|
( |
||||
|
|
|
|
|||||||
Cash Flows From Financing Activities: |
|
|
|
|
||||||
Proceeds from exercise of stock options |
|
|
|
|
|
|
||||
Repurchase of common stock |
— |
— |
( |
|||||||
Cash paid for repurchase of 2026 Senior Notes |
( |
( |
— |
|||||||
Repayment of notes payable |
( |
( |
( |
|||||||
Repayment of finance lease liabilities |
( |
( |
( |
|||||||
Net cash used in financing activities |
|
( |
|
( |
|
( |
||||
|
|
|
|
|||||||
Effect of exchange rates on cash and cash equivalents |
|
( |
|
( |
|
( |
||||
Net change in cash and cash equivalents |
( |
|
|
( |
||||||
Cash and cash equivalents — beginning of period |
|
|
|
|
|
|
||||
Cash and cash equivalents — end of period |
$ |
|
$ |
|
$ |
|
||||
Supplemental Disclosure of Cash Flow Information: |
||||||||||
Cash paid for interest |
$ |
|
$ |
|
$ |
|
||||
Cash paid for income taxes |
$ |
|
$ |
|
$ |
|
||||
Supplemental Disclosure of Non-Cash Financing Activities: |
||||||||||
Operating lease right-of-use assets and operating lease liabilities |
$ |
|
$ |
|
$ |
|
||||
Net unrealized gain on available-for-sale debt securities |
$ |
|
$ |
|
$ |
|
||||
Reclassification of realized gain (loss) on available-for-sale debt securities to earnings |
$ |
( |
$ |
( |
$ |
|
||||
Paid-in-kind preferred stock dividend, including beneficial conversion feature |
$ |
|
$ |
|
$ |
|
||||
Fixed assets included in accounts payable and accrued liabilities |
$ |
|
$ |
|
$ |
|
||||
Intangible assets included in property and equipment |
$ |
|
$ |
|
$ |
— |
||||
Purchase of equipment through finance lease obligation |
$ |
|
$ |
|
$ |
— |
||||
See accompanying notes to consolidated financial statements.
F-10
Cryoport, Inc. and Subsidiaries
Notes to Consolidated Financial Statements
Note 1. Nature of the Business
Cryoport is a leading global provider of innovative products and services supporting the life sciences. Our mission is to enable the future of medicine for a new era of life sciences. With over
The Company is a Nevada corporation and its common stock is traded on the NASDAQ Capital Market exchange under the ticker symbol “CYRX.”
Note 2. Summary of Significant Accounting Policies
Basis of Presentation
The accompanying consolidated financial statements have been prepared in accordance with accounting principles generally accepted in the United States of America (“U.S. GAAP”).
Principles of Consolidation
The accompanying consolidated financial statements include the accounts of Cryoport, Inc. and its wholly-owned subsidiaries. All intercompany accounts and transactions have been eliminated.
Cash and Cash Equivalents
Our cash and cash equivalents represent demand deposits, and money market funds which are readily convertible into cash, have maturities of
Short-Term Investments
Our investments in equity securities consist of mutual funds with readily determinable fair values which are carried at fair value with changes in fair value recognized in earnings.
Investments in debt securities are classified as available-for-sale and are carried at fair value, with unrealized gains and losses, net of tax, reported as accumulated other comprehensive income (loss) and included as a separate component of stockholders’ equity.
Gains and losses are recognized when realized. When we have determined that an other than temporary decline in fair value has occurred, the amount related to a credit loss is recognized in earnings. Gains and losses are determined using the specific identification method.
Short-term investments are classified as current assets even though maturities may extend beyond one year because they represent investments of cash available for operations.
F-11
Use of Estimates
The preparation of the consolidated financial statements in conformity with U.S. GAAP requires management to make estimates and assumptions that affect the reported amounts of assets and liabilities and disclosure of contingent assets and liabilities at the date of the consolidated financial statements and the reported amounts of revenues and expenses during the reporting periods. Actual results could differ from estimated amounts. The Company’s significant estimates include the fair value of short-term investments, valuations and purchase price allocations related to business combinations, expected future cash flows including growth rates, discount rates, terminal values and other assumptions and estimates, including valuation multiples utilized in the market approach used in impairment assessments, estimated fair values of intangible assets and goodwill, intangible asset useful lives and amortization methods, contingent consideration liability, equity-based instruments, tax reserves and recoverability of the Company’s net deferred tax assets and related valuation allowance.
Although the Company regularly assesses these estimates, actual results could differ materially from these estimates. Changes in estimates are recorded in the period in which they become known. The Company bases its estimates on historical experience and various other assumptions that it believes to be reasonable under the circumstances.
Future events and their effects cannot be predicted with certainty, and, accordingly the Company’s accounting estimates require the exercise of judgment.
Credit Losses
The Company estimates and records a provision for its expected credit losses related to its financial instruments, including its trade receivables. The Company considers historical collection rates, the current financial status of its customers, macroeconomic factors, and other industry-specific factors when evaluating for current expected credit losses. Forward-looking information is also considered in the evaluation of current expected credit losses. However, because of the short time to the expected receipt of accounts receivable, the Company believes that the carrying value, net of excepted losses, approximates fair value and therefore, relies more on historical and current analysis of such financial instruments, including its trade receivables.
To determine the provision for credit losses for accounts receivable, the Company has disaggregated its accounts receivable by class of customer at the business component level, as the Company determined that risk profile of its customers is consistent based on the type and industry in which they operate, mainly in the life sciences industry. Each business component is analyzed for estimated credit losses individually. In doing so, the Company establishes a historical loss matrix, based on the previous collections of accounts receivable by the age of such receivables, and evaluates the current and forecasted financial position of its customers, as available. Further, the Company considers macroeconomic factors and the status of the life sciences industry to estimate if there are current expected credit losses within its trade receivables based on the trends and the Company’s expectation of the future status of such economic and industry-specific factors. Also, specific allowance amounts are established based on review of outstanding invoices to record the appropriate provision for customers that have a higher probability of default.
Fair Value of Financial Instruments
The Company’s financial instruments consist of cash and cash equivalents, short-term investments, accounts receivable, accounts payable and accrued expenses, finance lease liabilities, notes payable, contingent consideration and the Company’s
Concentrations of Credit Risk
Financial instruments that potentially subject us to concentrations of credit risk consist primarily of cash, cash equivalents and short-term investments. From time to time, we maintain cash, cash equivalent and short-term investment balances in excess of amounts insured by the Federal Deposit Insurance Corporation (“FDIC”) and the Securities Investor Protection Corporation (“SIPC”). Primarily all of our cash, cash equivalents and short-term investments at December 31, 2023 were in excess of amounts insured by the FDIC and
F-12
SIPC. The Company performs ongoing evaluations of these institutions to limit its concentration risk exposure. We manage such risks in our portfolio by investing in highly liquid, highly rated instruments, and limit investing in long-term maturity instruments.
Our investment policy requires that purchased instruments in marketable securities may only be in highly rated instruments, which are primarily U.S. Treasury bills or treasury-backed securities, and also limits our investment in securities of any single issuer.
Inventories
Inventories are stated at the lower of cost and net realizable value. Cost is determined using the first-in, first-out (“FIFO”) method. Inventories are reviewed periodically for slow-moving or obsolete status. The Company writes down the carrying value of its inventories to reflect situations in which the cost of inventories is not expected to be recovered. Once established, write-downs of inventories are considered permanent adjustments to the cost basis of the obsolete or excess inventories. Raw materials and finished goods include material costs less adjustments for obsolete or excess inventories. The Company evaluates the current level of inventories considering historical trends and other factors, such as selling prices and costs of completion, disposal and transportation, and based on the evaluation, records adjustments to reflect inventories at net realizable value. These adjustments are estimates, which could vary significantly from actual results if future economic conditions, customer demand, competition or other relevant factors differ from expectations. These estimates require us to make assessments about future demand for the Company’s products in order to categorize the status of such inventories items as slow-moving, obsolete or in excess-of-need. These estimates are subject to the ongoing accuracy of the Company’s forecasts of market conditions, industry trends, competition and other factors.
Property and Equipment
Property and equipment are stated at cost, less accumulated depreciation. We compute depreciation using the straight-line method over the estimated useful lives of the assets which is generally to
Betterments, renewals and extraordinary repairs that extend the lives of the assets are capitalized; other repairs and maintenance charges are expensed as incurred. The cost and related accumulated depreciation and amortization applicable to assets retired are removed from the accounts, and the gain or loss on disposition is recognized in the consolidated statements of operations.
Leases
The Company determines if an arrangement is a lease at inception. Operating lease right-of-use (“ROU”) assets represent the Company’s right to use an underlying asset during the lease term, and operating lease liabilities represent the Company’s obligation to make lease payments arising from the lease. Operating leases are included in ROU assets, current operating lease liabilities, and long-term operating lease liabilities on our consolidated balance sheets. Finance leases are included in property and equipment, current finance lease liabilities, and long-term finance lease liabilities on our consolidated balance sheets.
Lease ROU assets and lease liabilities are initially recognized based on the present value of the future minimum lease payments over the lease term at commencement date calculated using our incremental borrowing rate applicable to the lease asset, unless the implicit rate is readily determinable. ROU assets also include any lease payments made at or before lease commencement and exclude any lease incentives received. Our lease terms may include options to extend or terminate the lease when it is reasonably certain that we will exercise that option. Leases with a term of 12 months or less are not recognized on the consolidated balance sheets. The Company’s leases do not contain any residual value guarantees. Lease expense for minimum lease payments is recognized on a straight-line basis over the lease term.
The Company accounts for lease and non-lease components as a single lease component for all its leases.
F-13
Business Combinations
Total consideration transferred for acquisitions is allocated to the assets acquired and liabilities assumed based on their fair values at the dates of acquisition. This purchase price allocation process requires management to make significant estimates and assumptions primarily with respect to intangible assets. The fair value of identifiable intangible assets is based on detailed valuations that use information and assumptions determined by management. Any excess of purchase price over the fair value of the net tangible and intangible assets acquired is allocated to goodwill. While the Company uses its best estimates and assumptions to accurately value assets acquired and liabilities assumed at the acquisition date as well as any contingent consideration, where applicable, the Company’s estimates are inherently uncertain and subject to refinement. As a result, during the measurement period, which may be up to one year from the acquisition date, the Company records adjustments to the assets acquired and liabilities assumed with the corresponding offset to goodwill.
Goodwill
The Company evaluates goodwill on an annual basis in the fourth quarter or more frequently if management believes indicators of impairment exist. Such indicators could include, but are not limited to: (1) a significant adverse change in legal factors or in business climate, (2) unanticipated competition, or (3) an adverse action or assessment by a regulator. For each reporting unit being tested, the Company compares the fair value of the reporting unit with its carrying amount and then recognizes an impairment charge for the amount by which the carrying amount exceeds the reporting unit’s fair value up to the total amount of goodwill allocated to the reporting unit. As a result of our 2023 quantitative assessment, we concluded that goodwill related to the MVE reporting unit is impaired as of December 31, 2023, and recorded an impairment charge of $
Management will continue to monitor the reporting units for changes in the business environment that could impact the recoverability in future periods. The recoverability of goodwill is dependent upon the continued growth of revenue and cash flows from the Company’s business activities. Examples of events or circumstances that could result in changes to the underlying key assumptions and judgments used in our goodwill impairment tests, and ultimately impact the estimated fair value of the Company’s reporting units include adverse macroeconomic or geopolitical conditions; and fluctuations in foreign currency exchange rates impacting the results of operations and the value of foreign assets and liabilities. While historical performance and current expectations have resulted in fair values of our reporting units in excess of carrying values, if our assumptions are not realized, it is possible that an impairment charge may need to be recorded in the future.
Intangible Assets
Indefinite-lived intangible assets are comprised of trade name/trademarks acquired in the Company’s recent acquisitions, and are tested for impairment annually using a relief from royalty method that relies on estimates of future revenues, royalty rates, and discount rates. If the asset is not found to be recoverable, it is written down to the estimated fair value. As a result of an interim impairment assessment performed as of June 30, 2024, we recorded a $
Intangible assets with a definite life are comprised of patents, trademarks, software development costs and the intangible assets acquired in the Company’s recent acquisitions which include a non-compete agreement, technology, customer relationships, trade name/trademark, agent network, order backlog, developed technology and land use rights. Intangible assets with a definite life are amortized using the straight-line method over the estimated useful lives (see Note 10). The Company uses the following valuation methodologies to value the significant intangible assets with a definite life acquired: income approach for customer relationships, replacement cost for agent network and software, and relief from royalty for trade name/trademarks and developed technology. The Company capitalizes costs of obtaining patents and trademarks, which are amortized, using the straight-line method over their estimated useful life of
F-14
The Company evaluates the recoverability of identifiable intangible assets with a definite life whenever events or changes in circumstances indicate that an intangible asset’s carrying amount may not be recoverable. Such circumstances could include, but are not limited to: (1) a significant decrease in the market value of an asset, (2) a significant adverse change in the extent or manner in which an asset is used, or (3) an accumulation of costs significantly in excess of the amount originally expected for the acquisition of an asset. The Company measures the carrying amount of the asset against the estimated undiscounted future cash flows associated with it. Should the sum of the expected future net cash flows be less than the carrying value of the asset being evaluated, an impairment loss would be recognized. The impairment loss would be calculated as the amount by which the carrying value of the asset exceeds its fair value. The estimate of fair value is based on various valuation techniques, including the discounted value of estimated future cash flows. The evaluation of asset impairment requires the Company to make assumptions about future cash flows over the life of the asset being evaluated. These assumptions require significant judgment and actual results may differ from assumed and estimated amounts. During the year ended December 31, 2023, due to macroeconomic factors impacting results of operations, the Company performed an impairment analysis of its amortizable intangible assets at the reporting unit level. The impairment analysis requires a comparison of undiscounted future cash flows expected to be generated over the useful life of an asset to the carrying value of the asset. Based on the impairment analysis performed, the estimated undiscounted cash flows exceeded the carrying amount of the assets and therefore no impairment charge was required. An interim impairment assessment was performed as of June 30, 2024, resulting in the estimated undiscounted cash flows exceeding the carrying amount of the assets and therefore no impairment charge was required.
Other Long-lived Assets
If indicators of impairment exist, we assess the recoverability of the affected long-lived assets by determining whether the carrying value of such assets can be recovered through undiscounted future operating cash flows. If impairment is indicated, we measure the amount of such impairment by comparing the fair value to the carrying value. We believe the future cash flows to be received from the long-lived assets will exceed the assets’ carrying value, and accordingly, we have not recognized any impairment losses through December 31, 2024.
Deferred Financing Costs
Deferred financing costs represent costs incurred in connection with the issuance of debt instruments and equity financings. Deferred financing costs related to the issuance of debt are amortized over the term of the financing instrument using the effective interest method and are presented in the consolidated balance sheets as an offset against the related debt. Offering costs from equity financings are netted against the gross proceeds received from the equity financings.
Income Taxes
The Company accounts for income taxes under the provision of Accounting Standards Codification (“ASC”) 740, “Income Taxes”, or ASC 740. As of December 31, 2024 and 2023, there were
Deferred tax assets and liabilities are measured using enacted tax rates expected to apply to taxable income in the years in which those temporary differences are expected to be recovered or settled. The effect on deferred tax assets and liabilities of a change in tax rates is recognized in income in the period that includes the enactment date. A valuation allowance is provided for certain deferred tax assets if it is more likely than not that the Company will not realize tax assets through future operations. Based on the weight of available evidence, the Company’s management has determined that it is not more likely than not that the U.S. based net deferred tax assets will be realized. Therefore, the Company has recorded a full valuation allowance against its U.S. based net deferred tax assets. With respect to the foreign based deferred tax assets, the Company’s management has reviewed these deferred tax assets on a jurisdictional basis. Based on the weight of each jurisdiction’s evidence available, the Company’s management has made separate determinations for each foreign jurisdiction regarding whether it is more likely than not that a net deferred tax asset within a particular jurisdiction will be realized. The Company has recorded full valuation allowances in jurisdictions where deferred tax assets are not deemed more likely than not to be realized.
The Company has recorded a net deferred tax liability in jurisdictions where taxable temporary differences associated with indefinite-lived intangible assets do not support the realization of deferred tax assets with finite carryforward periods. In addition, the Company has recorded a net deferred tax liability in jurisdictions where taxable temporary differences exceed deductible temporary differences.
F-15
The Company’s policy is to recognize interest and/or penalties related to income tax matters in income tax expense. The Company has recorded immaterial accruals for interest and/or penalties on its consolidated balance sheets at December 31, 2024 and 2023, and has recorded immaterial amounts of interest and/or penalties in the consolidated statements of operations for the years ended December 31, 2024, 2023 and 2022. The Company is subject to taxation in the U.S., in various U.S. state jurisdictions and in various foreign countries. As of December 31, 2024, the Company is no longer subject to U.S. federal examinations for years before 2021 or for California franchise and income tax examinations for years before 2020. However, to the extent allowed by law, the taxing authorities may have the right to examine net operating losses carried forward into a tax year and make adjustments up to the amount of the net operating losses utilized. The Company is not currently under examination in either the U.S. federal or any U.S. state jurisdictions. Our foreign subsidiaries are generally subject to examination for three years following the year in which the tax obligation originated. The years subject to audit may be extended if the entity substantially understates corporate income tax. The Company’s subsidiary in India is currently under examination by the Indian tax authorities for the 2012-2013, 2013-2014 and 2015-2016 tax periods. Other than India, the Company does not have any foreign subsidiaries currently under audit by their local taxing authorities.
On August 16, 2022, the United States enacted the Inflation Reduction Act of 2022, which imposes a 1% excise tax on publicly traded U.S. corporations for the fair market value of any stock repurchased during the tax year that exceeds $1.0 million, with certain specific exceptions. The excise tax is effective for transactions occurring in taxable years after December 31, 2023. There were
On June 29, 2020, the State of California passed Assembly Bill (“AB”) 85 which suspends the California net operating loss deduction for the 2020-2022 tax years and the R&D credit usage for the same period (for credit usages in excess of $
On March 11, 2021, the United States enacted the American Rescue Plan (“ARP”). The ARP includes provisions extending certain CARES Act provisions, repeals a worldwide interest allocation election, modifies the $
Revenue Recognition
Revenues are recognized when control is transferred to customers, in an amount that reflects the consideration the Company expects to be entitled to in exchange for those goods and services. Revenue recognition is evaluated through the following five steps: (i) identification of the contract, or contracts, with a customer; (ii) identification of the performance obligations in the contract; (iii) determination of the transaction price; (iv) allocation of the transaction price to the performance obligations in the contract; and (v) recognition of revenue when or as a performance obligation is satisfied.
Performance Obligations
At contract inception, an assessment of the goods and services promised in the contracts with customers is performed and a performance obligation is identified for each distinct promise to transfer to the customer a good or service (or bundle of goods or services). To identify the performance obligations, the Company considers all of the goods or services promised in the contract regardless of whether they are explicitly stated or are implied by customary business practices. Revenue is recognized when our performance obligation has been met. The Company considers control to have transferred upon delivery because the Company has a present right to payment at that time since the Company has satisfied its performance obligations related to the successful delivery. In instances where the customer has elected to use their own courier services, revenue is recognized upon delivery of the shipper to the customer.
For arrangements under which the Company provides biological specimen storage services and logistics support and management to the customer, the Company satisfies its performance obligations as those services are performed whereby the customer simultaneously receives and consumes the benefits of such services under the agreement.
Revenue generated from short-term logistics and engineering consulting services provided to customers is recognized when the Company satisfies the contractually defined performance obligations. When a contract includes multiple performance obligations, the contract price is allocated among the performance obligations based upon the stand-alone selling prices. Approved contract
F-16
modifications are accounted for as either a separate contract or as part of the existing contract depending on the nature of the modification.
Our performance obligations on our orders and under the terms of agreements with customers are generally satisfied within one year from a given reporting date and, therefore,
Shipping and handling activities related to contracts with customers are accounted for as costs to fulfill our promise to transfer the associated products pursuant to the accounting policy election allowed under Topic 606 and are not considered a separate performance obligation to our customers. Accordingly, the Company records amounts billed for shipping and handling as a component of revenue. Shipping and handling fees and costs are included in cost of revenues in the accompanying consolidated statements of operations.
Revenues are recognized net of any taxes collected from customers, which are subsequently remitted to governmental agencies.
Significant Payment Terms
Pursuant to the Company’s contracts with its customers, amounts billed for services or products delivered by the Company are generally due and payable in full within 15 to 60 days from the date of the invoice (except for any amounts disputed by the customer in good faith). Accordingly, the Company determined that its contracts with customers do not include extended payment terms or a significant financing component.
Variable Consideration
When a contract includes variable consideration, the Company evaluates the estimate of the variable consideration to determine whether the estimate needs to be constrained. Variable consideration is estimated at the most likely amount that is expected to be earned. Estimated amounts are included in the transaction price to the extent it is probable that a significant reversal of cumulative revenue recognized will not occur when the uncertainty associated with the variable consideration is resolved. Estimates of variable consideration and determination of whether to include estimated amounts in the transaction price are based largely on an assessment of the anticipated performance and all information (historical, current and forecasted) that is reasonably available. Variable consideration estimates are updated at each reporting date. Revenues are recorded net of variable consideration, such as discounts and allowances.
Warranties
The Company provides product warranties with varying terms and durations for some of its products. The Company estimates product warranty costs and accrues for these costs as products are sold with a charge to cost of sales. Factors considered in estimating warranty costs include historical and projected warranty claims, historical and projected cost-per-claim, and knowledge of specific product issues that are outside of typical experience. Warranty accruals are evaluated and adjusted as necessary based on actual claims experience and changes in future claim and cost estimates.
Product warranty accrued liabilities totaled $
Incremental Direct Costs
Incremental direct costs of obtaining a contract (sales commissions) are expensed when incurred when the amortization period of the asset that would have been recognized is one year or less; otherwise, incremental contract costs are recognized as an asset and amortized over time as promised goods and services are transferred to a customer. Incremental direct costs were not material for the years ended December 31, 2024, 2023 and 2022.
Contract Assets
Typically, we invoice the customer and recognize revenue once we have satisfied our performance obligation. Accordingly, our contract assets comprise accounts receivable, which are recognized when payment is unconditional and only the passage of time is
F-17
required before payment is due. Generally, we do not have material amounts of other contract assets since revenue is recognized as control of goods is transferred or as services are performed.
Nature of Goods and Services
The Company provides Cryoport Express® Shippers to its customers and charges a fee in exchange for the use of the Cryoport Express® Shipper under long-term service agreements with customers. The Company retains title to the Cryoport Express® Shippers and directs the use of the Cryoport Express® Shipper until delivery. At the culmination of the customer’s shipping cycle, the Cryoport Express® Shipper is returned to the Company.
The Company recognizes revenue for the use of the Cryoport Express® Shippers at the time of the delivery of the Cryoport Express® Shipper to the end user of the enclosed materials, and at the time that collectability is probable.
The Company also provides vacuum insulated aluminum dewars and cryogenic freezers systems to its customers. Revenue is recognized when the Company satisfies performance obligations by transferring the equipment to a customer, and at the time that collectability is probable.
The Company also provides global temperature-controlled logistics services, support and management. Revenue is recognized upon completion for these services and at the time that collectability is probable.
The Company also provides comprehensive and integrated temperature-controlled biostorage solutions to customers in the life sciences industry and charges a fee under long-term service agreements with customers. These services include (1) biological specimen cryopreservation storage and maintenance, (2) archiving, monitoring, tracking, receipt and delivery of samples, (3) transport of frozen biological specimens to and from customer locations, and (4) management of incoming and outgoing biological specimens. The Company recognizes revenue for its biostorage solutions as services are rendered over time and at the time that collectability is probable.
The Company also provides short-term logistics and engineering consulting services to some customers, with fees tied to the completion of contractually defined services. We recognize revenue from these services over time as the customer simultaneously receives and consumes the benefit of these services as they are performed.
A significant portion of our revenues are covered under long-term agreements. We have determined that individual Statements of Work or Scope of Work (“SOW”), whose terms and conditions taken with a Master Services Agreement (“MSA”), create the Topic 606 contracts which are generally short-term in nature (e.g., 15-day shipping cycle) for the Cryoport Express® solutions and up to 12 months for biostorage solutions. Our agreements (including SOWs) generally do not have multiple performance obligations and, therefore, do not require an allocation of a single price amongst multiple goods or services. Prices under these agreements are generally fixed.
Cost of Service Revenues
Our cost of service revenues is primarily comprised of freight charges, payroll and associated expenses related to our global logistics and supply chain centers, depreciation expenses of our Cryoport Express® Shippers and supplies and consumables used for our solutions.
Cost of Product Revenues
Our cost of product revenues is primarily comprised of materials, direct and indirect labor, inbound freight charges, purchasing and receiving, inspection, and distribution and warehousing of inventory. In addition, shop supplies, facility maintenance costs and depreciation expense for assets used in the manufacturing process are included in cost of product revenues.
Engineering and Development Expenses
Expenditures relating to engineering and development are expensed in the period incurred to engineering and development expense in the consolidated statements of operations.
F-18
Acquisition Costs
Acquisition costs consist of legal, accounting, third-party valuations, and other due diligence costs related to our acquisitions.
Stock-Based Compensation
Under our stockholder approved stock-based compensation plan, we have granted incentive stock options, non-qualified stock options and restricted stock units that vest over
The grant date fair value per share for restricted stock units is based upon the closing market price of our common stock on the award grant date.
The Company’s stock-based compensation plans are discussed further in Note 18.
Foreign Currency Transactions
Management has determined that the functional currency of its subsidiaries is the local currency. The Company translates the assets and liabilities of its foreign subsidiaries into U.S. dollars at exchange rates in effect at the end of the reporting period. Income and expenses are translated at an average exchange rate for the period and the resulting translation gain (loss) adjustments are accumulated as a separate component of stockholders’ equity. The translation gain (loss) adjustment totaled ($
Off-Balance Sheet Arrangements
We do not currently have any off-balance sheet arrangements.
Subsequent Events
The Company has evaluated subsequent events through the date of this filing and determined that no subsequent events have occurred that would require recognition in these consolidated financial statements or disclosure in the notes thereto.
Recently Adopted Accounting Pronouncements
In November 2023, the FASB issued ASU 2023-07, “Segment Reporting (Topic 280): Improvements to Reportable Segment Disclosures,” which requires all public entities, including those that have a single reportable segment, to provide enhanced disclosures primarily about significant segment expenses. ASU 2023-07 is effective for fiscal years beginning after December 15, 2023, and interim periods within fiscal years beginning after December 15, 2024. The new guidance is required to be applied on a retrospective basis, with all required disclosures to be made for all prior periods presented in the financial statements. The segment expense categories and amounts disclosed in prior periods should be based on the significant segment expense categories identified and disclosed in the period of adoption. We adopted ASU 2023-07 on January 1, 2024. The adoption of this standard did not have a significant impact on the Company’s disclosures.
In June 2022, the Financial Accounting Standards Board (“FASB”) issued ASU 2022-03, “Fair Value Measurement (Topic 820): Fair Value Measurement of Equity Securities Subject to Contractual Sale Restrictions,” which amends the guidance in Topic 820, Fair Value Measurement, to clarify that a contractual restriction on the sale of an equity security is not considered part of the unit of account of the equity security and, therefore, is not considered in measuring fair value. The amendments also clarify that an entity cannot, as a separate unit of account, recognize and measure a contractual sale restriction. In addition, the ASU introduces new
F-19
disclosure requirements for equity securities subject to contractual sale restrictions that are measured at fair value. ASU 2022-03 is effective for fiscal years beginning after December 15, 2023, including interim periods within those fiscal years for public business entities. We adopted ASU 2022-03 on January 1, 2024 which only impacted the related disclosure. See Note 20.
Accounting Guidance Issued but Not Adopted at December 31, 2024
In November 2024, the FASB issued ASU 2024-04, “Debt—Debt with Conversion and Other Options (Subtopic 470-20): Induced Conversions of Convertible Debt Instruments,” which clarifies the assessment of whether certain settlements of convertible debt instruments should be accounted for as an inducement conversion or extinguishment of convertible debt. The new guidance is effective for annual periods beginning after December 15, 2025, and interim periods within those annual periods. We are currently evaluating the impact of this standard on our consolidated financial statements.
In November 2024, the FASB issued ASU 2024-03, “Income Statement—Reporting Comprehensive Income—Expense Disaggregation Disclosures (Subtopic 220-40): Disaggregation of Income Statement Expenses,” which requires disclosure of additional disaggregated information about significant expenses within relevant income statement captions, such as purchases of inventory, employee compensation, depreciation, amortization and depletion. The new guidance is effective for annual periods beginning after December 15, 2026, and interim periods within annual periods beginning after December 15, 2027. We are currently evaluating the impact of this standard on our consolidated financial statements.
In March 2024, the FASB issued ASU 2024-02 “Codification Improvements—Amendments to Remove References to the Concept Statements,” which amends the Codification to remove references to various FASB Concepts Statements and impacts a variety of Topics in the Codification. The amendments apply to all reporting entities within the scope of the affected accounting guidance, but in most instances the references removed are extraneous and are not required to understand or apply the guidance. Generally, the amendments in ASU 2024-02 are not intended to result in significant accounting changes for most entities. ASU 2024-02 is effective for the Company for fiscal years beginning after December 15, 2024, and interim periods within those fiscal years. Entities may apply the guidance either retrospectively to the beginning of the earliest comparative period presented or prospectively to all new or modified transactions recognized on or after the date of adoption. We are currently evaluating the impact of this standard on our consolidated financial statements.
In March 2024, the FASB issued ASU 2024-01, “Compensation—Stock Compensation (Topic 718): Scope Application of Profits Interest and Similar Awards,” which clarifies how an entity determines whether a profits interest or similar award is within the scope of Topic 718, or is not a share-based payment arrangement and therefore within the scope of other guidance. ASU 2024-01 adds an example with multiple fact patterns and illustrates how an entity evaluates common terms and characteristics of profits interests and similar awards to reach a conclusion about whether an award meets the conditions in Topic 718. It also amends certain language in the “Scope” and “Scope Exceptions” sections of Topic 718 to improve its clarity and operability without changing the guidance. ASU 2024-01 is effective for the Company for fiscal years beginning after December 15, 2024, and interim periods within those fiscal years. Entities may apply the guidance either retrospectively to all periods presented in the financial statements or prospectively to profits interest and similar awards granted or modified on or after the date of adoption. We are currently evaluating the impact of this standard on our consolidated financial statements.
In December 2023, the FASB issued ASU 2023-09, “Income Taxes (Topic 740): Improvements to Income Tax Disclosures,” which is intended to enhance the transparency and decision usefulness of income tax disclosures. Notably, the ASU requires entities to disclose specific categories in the effective tax rate reconciliation and provide additional information for reconciling items that meet a quantitative threshold, as well as disclosures of income taxes paid disaggregated by jurisdiction. ASU 2023-09 is effective for annual periods beginning after December 15, 2024 on a prospective basis. Retrospective application to each period presented in the financial statements is permitted. We are currently evaluating the impact of this standard on our consolidated financial statements.
In October 2023, the FASB issued ASU 2023-06, “Disclosure Improvements—Codification Amendments in Response to the SEC’s Disclosure Update and Simplification Initiative.” This ASU modifies the disclosure or presentation requirements of a variety of Topics in the Codification by aligning them with the SEC’s regulations. The amendments to the various Topics should be applied prospectively, and the effective date for the Company for each amendment will be determined based on the effective date of the SEC’s removal of the related disclosure from Regulation S-X or Regulation S-K. If the SEC has not removed the applicable requirement by June 30, 2027, then the related amendment in ASU 2023-06 will be removed from the Codification and will not become effective. Early adoption of this ASU is prohibited. We do not expect the amendments in this ASU to have a material impact on the disclosures or presentation in our consolidated financial statements.
F-20
Note 3. Revenue, Concentration and Geographic Information
Customers
The Company grants credit to customers within the U.S. and international customers and does not require collateral. Revenue from international customers is generally secured by advance payments except for established foreign customers. The Company generally requires advance or credit card payments for initial revenue from new customers. The Company’s ability to collect receivables can be affected by economic fluctuations in the geographic areas and industries served by the Company.
The Company’s customers are in the biopharma, pharmaceutical, animal health, reproductive medicine and other life science industries. Consequently, there is a concentration of accounts receivable within these industries, which is subject to normal credit risk. There was no single customer that represented more than 10% of net accounts receivable at December 31, 2024 and 2023.
The Company has revenue from foreign customers primarily in the United Kingdom, France, Germany, China and India. During the years ended December 31, 2024, 2023 and 2022, the Company had revenue from foreign customers of approximately $
Revenue Disaggregation
The Company views its operations, makes decisions regarding how to allocate resources and manages its business as
December 31, |
|||||||||
|
2024 |
|
2023 |
|
2022 |
||||
BioLogistics Solutions |
$ |
|
$ |
|
$ |
|
|||
BioStorage/BioServices |
|
|
|
|
|
|
|||
Life Sciences Services |
|
|
|
||||||
Life Sciences Products |
|
|
|
||||||
Total revenue |
$ |
|
$ |
|
$ |
|
|||
Given that the Company’s revenue is generated in different geographic regions, factors such as regulatory and geopolitical factors within those regions could impact the nature, timing and uncertainty of the Company’s revenue and cash flows. Our geographical revenue, by origin, for the years ended December 31, 2024, 2023 and 2022, was as follows (in thousands):
December 31, |
|||||||||
|
2024 |
|
2023 |
|
2022 |
||||
Americas |
$ |
|
$ |
|
$ |
|
|||
Europe, the Middle East, and Africa (EMEA) |
|
|
|
|
|
|
|||
Asia Pacific (APAC) |
|
|
|
|
|
|
|||
Total revenue |
$ |
|
$ |
|
$ |
|
|||
F-21
Contract Liabilities (Deferred Revenue)
Contract liabilities are recorded when cash payments are received in advance of the Company’s performance. Deferred revenue was $
Credit Losses
Accounts receivable at December 31, 2024, and 2023 are net of allowance for credit losses of $
December 31, |
||||||
|
2024 |
|
2023 |
|||
Balance of allowance for credit losses, beginning of period |
$ |
|
|
|||
Change in expected credit losses |
( |
|
||||
Write-offs, net of recoveries |
|
( |
( |
|||
Balance of allowance for credit losses, end of period |
$ |
|
|
|||
Note 4. Net Loss Per Share
We calculate basic and diluted net loss per share using the weighted average number of common shares outstanding during the periods presented. In periods of a net loss position, basic and diluted weighted average common shares are the same. For the diluted earnings per share calculation, we adjust the weighted average number of common shares outstanding to include dilutive stock options, unvested restricted stock units and shares associated with the conversion of the Company’s
The following shows the amounts used in computing net loss per share (in thousands except per share data):
Year Ended December 31, |
|||||||||
|
2024 |
|
2023 |
|
2022 |
||||
Net loss |
$ |
( |
$ |
( |
$ |
( |
|||
Paid-in-kind dividend on Series C Preferred Stock |
|
( |
|
( |
|
( |
|||
Net loss attributable to common shareholders |
$ |
( |
$ |
( |
$ |
( |
|||
Weighted average common shares issued and outstanding - basic and diluted |
|
|
|
||||||
Basic and diluted net loss per share |
$ |
( |
$ |
( |
$ |
( |
|||
The following table sets forth the number of shares excluded from the computation of diluted loss per share, as their inclusion would have been anti-dilutive:
Years Ended December 31, |
||||||
|
2024 |
|
2023 |
|
2022 |
|
Stock options |
|
|
|
|
|
|
Restricted stock units |
|
|
|
|||
Series C convertible preferred stock |
|
|
|
|||
Convertible Senior Notes |
|
|
|
|
|
|
|
|
|
|
|
||
F-22
Note 5. Acquisitions
2023 Acquisitions
SCI JA8 Acquisition
In October 2023, the Company completed the asset acquisition of SCI JA8, consisting substantially of real estate property used as administrative offices and a Global Supply Chain Center located in Clermont Ferrand, France. The purchase consideration was €
Tec4med Life Science Acquisition
In November 2023, the Company completed the acquisition of TEC4MED LifeScience GmbH (“Tec4med”) based in Darmstadt, Germany. Tec4med provides next generation pharmaceutical supply chain visibility by integrating condition monitoring, cloud and artificial intelligence (AI) solutions. ISO 9001-certified, Tec4med works with pharmaceutical-compliant, ready-to-use devices and software, offering customer-specific integrations. Tec4med broadens Cryoport’s portfolio of condition monitoring solutions and provides additional resources and capabilities to drive new product development and accelerate its European market expansion, particularly in the DACH region (Germany, Austria, Switzerland). The purchase consideration was €
Bluebird Express Acquisition
In November 2023, the Company also acquired Bluebird Express, LLC ("Bluebird Express"), a provider of time-sensitive domestic and international transportation services with key operations centers in Los Angeles (LAX) and New York (JFK). Bluebird Express has over
The Bluebird Express acquisition was accounted for under the acquisition method of accounting in accordance with FASB ASC Topic 805, “Business Combinations,” and, therefore, the total purchase price was allocated to the identifiable tangible and intangible assets acquired and the liabilities assumed based on their respective fair values on the acquisition date. Fair values were determined by management based in part on an independent valuation performed by a third-party valuation specialist and required the use of significant assumptions and estimates. Critical estimates included, but were not limited to, future expected cash flows, including projected revenue and expenses, and the applicable discount rates. These estimates were based on assumptions that the Company believes to be reasonable; however, actual results may differ from these estimates.
The purchase consideration was $
F-23
The following table summarizes the allocation of the purchase price as of the acquisition date (in thousands):
Total purchase consideration paid |
$ |
|
|
Purchase price allocation: |
|
|
|
Cash and cash equivalents |
|
|
|
Accounts receivable |
|
|
|
Prepaid and other current assets |
|
|
|
Property and equipment |
|
|
|
Operating lease right-of-use assets |
|
|
|
Intangible assets |
|
|
|
Accounts payable and other accrued expenses |
|
( |
|
Operating lease liabilities |
|
( |
|
Total identifiable net assets |
|
|
|
Goodwill |
|
|
|
$ |
|
The following table summarizes the estimated fair values of Bluebird Express’ identifiable intangible assets at the date of acquisition and their estimated useful lives and amortization expense based on their respective useful lives (in thousands):
|
|
|
|
|
|
|
Annual |
|||
Estimated |
Estimated |
Amortization |
Amortization |
|||||||
Fair Value |
Useful Life |
Method |
Expense |
|||||||
Customer relationships |
$ |
|
|
|
Straight-line |
$ |
|
|||
Non-competition agreement |
|
|
|
|
Straight-line |
|
|
|||
Agent network |
|
|
|
|
Straight-line |
|
|
|||
Trade names/trademarks - finite-lived |
|
|
|
|
Straight-line |
|
|
|||
Total |
$ |
|
|
|
|
|
$ |
|
||
Goodwill is calculated as the excess of the purchase price over the fair value of net assets acquired and represents the future economic benefits arising from other assets acquired that could not be individually identified and separately recognized. Among the factors that contributed to a purchase price in excess of the fair value of the net tangible and intangible assets acquired were the acquisition of an assembled workforce, the expected synergies, and other benefits that we believe will result from combining the operations of Bluebird Express with our operations. The goodwill recognized of $
Acquisition-related transaction costs (included in selling, general and administrative expenses) totaled approximately $
Total revenue and net loss would have been $
2022 Acquisitions
In April 2022, we completed the acquisition of Cell&Co BioServices in Clermont-Ferrand, France with additional operations in Pont-du-Château, France to further enhance our existing global temperature-controlled supply chain capabilities. Cell&Co BioServices is a bioservices business providing biorepository, kitting, and logistics services to the life sciences industry. The purchase consideration was €
F-24
In July 2022, the Company completed the acquisition of Polar Expres based in Madrid, Spain, which provides temperature-controlled logistics solutions dedicated to the life sciences industry. Polar Expres operates logistics centers in Madrid and Barcelona supporting the rapidly growing life science market. This acquisition further expands CRYOPDP’s footprint which enhances our existing global temperature-controlled supply chain capabilities and provides us with additional growth opportunities in the EMEA region. The purchase consideration was €
In July 2022, the Company also completed the acquisition of Cell Matters based in Liège, Belgium, which provides cryo-process optimization, cryoprocessing, and cryopreservation solutions to the life sciences industry. The purchase consideration was €
Note 6. Cash, Cash Equivalents and Short-term Investments
Cash, cash equivalents and short-term investments consisted of the following as of December 31, 2024 and 2023 (in thousands):
Carrying Value |
||||||
|
2024 |
|
2023 |
|||
Cash |
$ |
|
$ |
|
||
Cash equivalents: |
|
|||||
Money market mutual fund |
|
|
|
|||
Total cash and cash equivalents |
|
|
|
|||
Short-term investments: |
|
|||||
U.S. Treasury notes and bills |
|
|
|
|||
Mutual funds |
|
|
|
|||
Corporate debt securities |
|
|
||||
Total short-term investments |
|
|
|
|||
Cash, cash equivalents and short-term investments |
$ |
|
$ |
|
||
Available-for-sale investments
The amortized cost, gross unrealized gains, gross unrealized losses and fair value of available-for-sale investments by type of security at December 31, 2024 were as follows (in thousands):
Amortized |
Unrealized |
Unrealized |
||||||||||
|
Cost |
|
Gains |
|
Losses |
|
Fair Value |
|||||
U.S. Treasury notes |
$ |
|
$ |
$ |
— |
$ |
||||||
Corporate debt securities |
|
— |
||||||||||
Total available-for-sale investments |
$ |
|
$ |
$ |
— |
$ |
||||||
F-25
The following table summarizes the fair value of available-for-sale investments based on stated contractual maturities as of December 31, 2024:
|
Amortized Cost |
|
Fair Value |
|||
Due within one year |
$ |
|
$ |
|
||
Due after one year through five years |
|
|
||||
Due after five years through ten years |
|
- |
|
- |
||
Total |
$ |
|
$ |
|
||
The amortized cost, gross unrealized gains, gross unrealized losses and fair value of available-for-sale investments by type of security at December 31, 2023 were as follows (in thousands):
Amortized |
Unrealized |
Unrealized |
||||||||||
|
Cost |
|
Gains |
|
Losses |
|
Fair Value |
|||||
U.S. Treasury notes |
$ |
|
|
$ |
|
$ |
( |
$ |
|
|||
Corporate debt securities |
|
|
|
|
( |
|
||||||
Total available-for-sale investments |
$ |
|
|
$ |
|
$ |
( |
$ |
|
|||
The following table summarizes the fair value of available-for-sale investments based on stated contractual maturities as of December 31, 2023 (in thousands):
|
Amortized Cost |
|
Fair Value |
|||
Due within one year |
$ |
|
|
$ |
|
|
Due after one year through five years |
|
|
|
|
|
|
Total |
$ |
|
|
$ |
|
|
The primary objective of our investment portfolio is to enhance overall returns in an efficient manner while maintaining safety of principal, prudent levels of liquidity and acceptable levels of risk. Our investment policy limits interest-bearing security investments to certain types of debt and money market instruments issued by institutions with primarily investment-grade credit ratings, and it places restrictions on maturities and concentration by asset class and issuer.
We review our available-for-sale investments for other-than-temporary declines in fair value below our cost basis each quarter and whenever events or changes in circumstances indicate that the cost basis of an asset may not be recoverable. The evaluation is based on a number of factors, including the length of time and the extent to which the fair value has been below our cost basis, as well as adverse conditions related specifically to the security such as any changes to the credit rating of the security and the intent to sell or whether we will more likely than not be required to sell the security before recovery of its amortized cost basis. Our assessment of whether a security is other-than-temporarily impaired could change in the future based on new developments or changes in assumptions related to that particular security.
The following table shows the Company’s gross unrealized losses and fair value of available-for-sale debt securities, aggregated by investment category and length of time that individual securities have been in a continuous unrealized loss position at December 31, 2024:
|
Less than 12 Months |
|
12 Months or More |
|
Total |
|||||||||||||
Unrealized |
Unrealized |
Unrealized |
||||||||||||||||
Fair Value |
Losses |
Fair Value |
Losses |
Fair Value |
Losses |
|||||||||||||
U.S. Treasury notes |
$ |
— |
$ |
— |
$ |
|
$ |
( |
$ |
|
$ |
( |
||||||
Corporate debt securities |
|
— |
|
— |
|
|
|
( |
|
|
|
( |
||||||
Total |
$ |
— |
$ |
— |
$ |
|
$ |
( |
$ |
|
$ |
( |
||||||
For U.S. Treasury notes, the unrealized losses were caused by interest rate increases. The contractual terms of those investments do not permit the issuer to settle the securities at a price less than the amortized cost of the investment. Because the Company does not intend to sell the investments and it is not more likely than not that the Company will be required to sell the investments before recovery of their amortized cost bases, which may be maturity, the Company does not consider the U.S. Treasury notes to be other-than-temporarily impaired at December 31, 2024. For corporate debt securities, the unrealized losses were primarily caused by interest rate
F-26
increases. The Company does not intend to sell these debt securities that are in an unrealized loss position, and it is not more likely than not that the Company will be required to sell these debt securities before recovery of their amortized cost bases, which may be at maturity. Based on the credit quality of the debt securities, and the Company’s estimates of future cash flows to be collected from those securities, the Company believes the unrealized losses are not credit losses. Accordingly, the Company does not consider the corporate debt securities to be other-than-temporarily impaired at December 31, 2024.
During the years ended December 31, 2024, 2023 and 2022, we had realized losses of $
Equity Investments
We held investments in equity securities with readily determinable fair values of $
Unrealized gains (losses) during 2024, 2023 and 2022 related to equity securities held at December 31, 2024, 2023 and 2022 are as follows (in thousands):
|
Year Ended December 31, |
||||||||
|
2024 |
|
2023 |
|
2022 |
||||
Net losses recognized during the year on equity securities |
$ |
( |
$ |
( |
$ |
( |
|||
Less: net gains recognized during the year on equity securities sold during the year |
|
|
|
|
— |
||||
Unrealized gains (losses) recognized during the year on equity securities still held at December 31, 2024, 2023 and 2022 |
$ |
( |
$ |
|
$ |
( |
|||
Note 7. Fair Value Measurements
We measure fair value based on the prices that would be received to sell an asset or paid to transfer a liability in an orderly transaction between market participants at the measurement date. Fair value measurements are based on a three-tier hierarchy that prioritizes the inputs used to measure fair value. These tiers include the following:
Level 1: Quoted prices (unadjusted) in active markets for identical assets or liabilities that are accessible at the measurement date. The fair value hierarchy gives the highest priority to Level 1 inputs.
Level 2: Observable prices that are based on inputs not quoted on active markets but corroborated by market data. These inputs include quoted prices for similar assets or liabilities; quoted market prices in markets that are not active; or other inputs that are observable or can be corroborated by observable market data for substantially the full term of the assets or liabilities.
Level 3: Unobservable inputs are used when little or no market data is available. The fair value hierarchy gives the lowest priority to Level 3 inputs.
In determining fair value, we utilize valuation techniques that maximize the use of observable inputs and minimize the use of unobservable inputs to the extent possible, as well as consider counterparty credit risk in the assessment of fair value.
We did not elect the fair value option, as allowed, to account for financial assets and liabilities that were not previously carried at fair value. Therefore, material financial assets and liabilities that are not carried at fair value, such as trade accounts receivable and payable, are reported at their historical carrying values.
F-27
The carrying values of our assets that are required to be measured at fair value on a recurring basis as of December 31, 2024 and 2023 approximate fair value because of our ability to immediately convert these instruments into cash with minimal expected change in value which are classified in the table below in one of the three categories of the fair value hierarchy described above (in thousands):
|
Fair Value Measurements |
|||||||||||
|
Level 1 |
|
Level 2 |
|
Level 3 |
|
Total |
|||||
December 31, 2024 |
|
|||||||||||
Assets: |
|
|
|
|
|
|
|
|
||||
Money market mutual fund |
$ |
|
$ |
— |
$ |
— |
$ |
|
||||
Mutual funds |
|
|
|
— |
|
— |
|
|
||||
U.S. Treasury notes |
|
|
|
— |
|
— |
|
|
||||
Corporate debt securities |
|
|
|
— |
|
— |
|
|
||||
$ |
|
$ |
— |
$ |
— |
$ |
|
|||||
Liabilities: |
||||||||||||
Convertible Senior Notes |
$ |
— |
$ |
|
$ |
— |
$ |
|
||||
Contingent consideration |
|
— |
|
— |
|
|
|
|||||
$ |
— |
$ |
|
$ |
|
$ |
|
|||||
Fair Value Measurements |
||||||||||||
|
Level 1 |
|
Level 2 |
|
Level 3 |
|
Total |
|||||
December 31, 2023 |
||||||||||||
Assets: |
|
|
|
|
|
|
|
|
||||
Money market mutual fund |
$ |
|
$ |
— |
$ |
— |
$ |
|
||||
Mutual funds |
|
|
|
— |
|
— |
|
|
||||
U.S. Treasury notes |
|
|
|
— |
|
— |
|
|
||||
Corporate debt securities |
|
|
|
— |
|
— |
|
|
||||
$ |
|
$ |
— |
$ |
— |
$ |
|
|||||
Liabilities: |
||||||||||||
Convertible Senior Notes |
$ |
— |
$ |
$ |
— |
$ |
|
|||||
Contingent consideration |
|
— |
|
— |
|
|
||||||
$ |
— |
$ |
|
$ |
|
$ |
|
|||||
Our equity securities and available-for-sale debt securities, including U.S. treasury notes are valued using inputs observable in active markets for identical securities and are therefore classified as Level 1 within the fair value hierarchy.
We did not have any financial liabilities measured at fair value on a recurring basis as of December 31, 2024 and 2023.
We carry the Convertible Senior Notes (see Note 12) at face value less the unamortized discount and issuance costs on our consolidated balance sheets and present fair value for disclosure purposes only. We estimate the fair value of the Convertible Senior Notes using the net present value of the payments, discounted at an interest rate that is consistent with market and risk-adjusted interest rates, which is a Level 2 input.
The following table presents the estimated fair values and the carrying values (in thousands):
|
December 31, 2024 |
December 31, 2023 |
||||||||||
|
Carrying Value |
|
Fair Value |
|
Carrying Value |
|
Fair Value |
|||||
2026 Senior Notes |
$ |
|
$ |
|
$ |
|
$ |
|
||||
2025 Senior Notes |
$ |
|
$ |
|
$ |
|
$ |
|
||||
Under the terms of the Critical Transport Solutions Australia (“CTSA”) acquisition, contingent consideration may be payable in cash based on the achievement of a certain EBITDA target for 2024, with no maximum limit as to the contingent consideration achievable. Under the terms of the F-airGate, Cell&Co, Polar Expres, and Bluebird Express acquisitions, contingent consideration may be payable in cash based on the achievement of certain future revenue and/or EBITDA targets during each annual period following the acquisition dates for a total of
F-28
consideration for the F-airGate and Polar Expres acquisitions was determined using a probability-weighted discounted cash flow model. The fair value of the contingent consideration for the CTSA, Cell&Co and Bluebird Express acquisitions was valued based on unobservable inputs using a Monte Carlo simulation. These inputs included the estimated amount and timing of projected future revenue, a discount rate, a risk-free rate, asset volatility and revenue volatility. Significant increases (decreases) in any of those inputs in isolation would result in a significantly higher (lower) fair value measurement. The contingent consideration was determined to have an aggregate fair value of $
The (gains) losses recognized in earnings and the change in net assets related to the contingent consideration at December 31, 2024 were as follows (in thousands):
|
Fair Value |
|
Gains |
|
|
Reclassification |
|
Foreign |
|
Fair Value |
||||||||
December 31, |
recognized in |
to current |
Currency |
December 31, |
||||||||||||||
2023 |
earnings |
Payments |
payables |
Adjustment |
2024 |
|||||||||||||
$ |
|
$ |
( |
$ |
— |
$ |
— |
$ |
( |
$ |
|
|||||||
|
|
|
( |
|
— |
|
( |
|
( |
|
|
|||||||
|
( |
( |
— |
— |
|
|||||||||||||
$ |
|
$ |
( |
$ |
( |
$ |
( |
$ |
( |
$ |
|
|||||||
The net gains recognized in earnings have been reported in operating expenses in the consolidated statement of operations for the year ended December 31, 2024.
Note 8. Inventories
Inventories consist of the following (in thousands):
December 31, |
December 31, |
|||||
|
2024 |
|
2023 |
|||
Raw materials |
$ |
|
$ |
|
||
Work-in-process |
|
|
||||
Finished goods |
|
|
|
|
||
Total |
$ |
|
$ |
|
||
Note 9. Property and Equipment
Property and equipment consist of the following (in thousands):
December 31, |
December 31, |
|||||
2024 |
2023 |
|||||
Cryogenic shippers and data loggers |
|
$ |
|
|
$ |
|
Freezers |
|
|
|
|
||
Furniture and fixtures |
|
|
|
|
||
Computers and software |
|
|
|
|
||
Machinery and equipment |
|
|
|
|
||
Trucks and autos |
|
|
|
|
||
Leasehold improvements |
|
|
|
|
||
Buildings |
|
|
|
|
||
Land |
|
|
|
|
||
Fixed assets in process |
|
|
|
|
||
|
|
|
|
|||
Less accumulated depreciation and amortization |
|
( |
|
( |
||
$ |
|
$ |
|
|||
F-29
Total depreciation and amortization expense related to property and equipment amounted to $
The Company leases equipment under finance leases, with a total cost of $
Fixed assets in process primarily relates to $
Geographic information
Certain geographic information with respect to property and equipment was as follows (in thousands):
|
December 31, |
|||||
2024 |
|
2023 |
||||
United States |
$ |
|
$ |
|
||
Rest of world (1) |
|
|
|
|
||
Total property and equipment, net |
$ |
|
$ |
|
||
(1) |
No individual country exceeded 10% of our total property and equipment for any period presented. |
Note 10. Goodwill and Intangible Assets
Goodwill
The following table represents the changes in the carrying value of goodwill for the years ended December 31, 2024 and 2023 (in thousands):
December 31, |
|||||
2024 |
|
2023 |
|||
Balance at beginning of period |
|||||
Goodwill |
$ |
|
$ |
|
|
Accumulated impairment losses |
( |
— |
|||
Subtotal |
|
|
|||
Activity during the period |
|||||
Foreign currency adjustment |
( |
( |
|||
Goodwill impairment charge |
( |
( |
|||
Goodwill related to Tec4med acquisition |
|
— |
|
|
|
Goodwill related to Bluebird Express acquisition |
|
|
|||
Balance at end of period |
|||||
Goodwill |
|
|
|||
Accumulated impairment losses |
( |
( |
|||
Total |
$ |
|
$ |
|
|
Impairment of Goodwill
2024 Impairment
Due to a sustained decrease in the Company’s share price in the second quarter of 2024, and a reduction in the projected operating performance of the MVE reporting unit, which management deemed to be triggering events related to goodwill and indefinite-lived intangible assets, we performed an interim impairment assessment of goodwill for the MVE and CRYOPDP reporting units as of June 30, 2024, with the assistance of an independent third party valuation specialist, using management’s updated interim financial and operational plans. Based on our analysis, we concluded that there has been no impairment of the goodwill associated with the CRYOPDP reporting unit as its carrying value did not exceed its estimated fair value. We further concluded that our MVE reporting unit’s carrying
F-30
value exceeded its estimated fair value, and as a result, we recorded an impairment charge of $
Our goodwill impairment test was performed using a combination of both an income and a market approach to determine the fair value of the MVE reporting unit. The income approach utilized the estimated discounted cash flows for MVE while the market approach utilized comparable peer group information. Estimates and assumptions used in the income approach included projected cash flows for MVE and a discount rate determined using a weighted average cost of capital for risk factors specific to MVE and other market and industry data. The discount rate selected was
2023 Impairment
We performed our annual impairment test of goodwill for the CRYOPDP and MVE reporting units as of October 1, 2023, with the assistance of an independent third party valuation specialist, using management’s updated annual financial and operational plans. Based on our analysis, we concluded that there has been no impairment of the goodwill associated with the CRYOPDP reporting unit as its carrying value did not exceed its estimated fair value. We concluded that our MVE reporting unit’s carrying value exceeded its estimated fair value, and as a result, we recorded a goodwill impairment charge of $
Our goodwill impairment test was performed using a combination of both an income and a market approach to determine the fair value of the MVE reporting unit. The income approach utilized the estimated discounted cash flows for MVE while the market approach utilized comparable peer group information. Estimates and assumptions used in the income approach included projected cash flows for MVE and a discount rate determined using a weighted average cost of capital for risk factors specific to MVE and other market and industry data. The discount rate selected was
As of December 31, 2023, remaining goodwill allocated to the MVE reporting unit was $
Intangible Assets
The following table presents our intangible assets as of December 31, 2024 (in thousands):
Weighted |
||||||||||||||
Net |
Average |
|||||||||||||
Gross |
Accumulated |
Carrying |
Amortization |
|||||||||||
|
Amount |
|
Amortization |
|
Impairment |
|
Amount |
|
Period (years) |
|||||
Non-compete agreement |
$ |
|
$ |
|
$ |
— |
$ |
|
|
|||||
Technology |
|
|
— |
|
||||||||||
Customer relationships |
|
|
— |
|
||||||||||
Trade name/trademark |
|
|
( |
|
||||||||||
Agent network |
|
|
— |
|
||||||||||
Order backlog |
|
|
— |
— |
— |
|||||||||
Land use rights |
|
|
— |
|
||||||||||
Patents and trademarks |
|
|
( |
|
— |
|||||||||
Total |
$ |
|
$ |
|
$ |
( |
$ |
|
||||||
F-31
The following table presents our intangible assets as of December 31, 2023 (in thousands):
Weighted |
||||||||||||||
Net |
Average |
|||||||||||||
Gross |
Accumulated |
Carrying |
Amortization |
|||||||||||
|
Amount |
|
Amortization |
|
Impairment |
|
Amount |
|
Period (years) |
|||||
Non-compete agreement |
$ |
|
$ |
|
$ |
— |
$ |
|
|
|||||
Technology |
|
|
— |
|
||||||||||
Customer relationships |
|
|
— |
|
||||||||||
Trade name/trademark |
|
|
— |
|
||||||||||
Agent network |
|
|
— |
|
||||||||||
Order backlog |
|
|
— |
— |
— |
|||||||||
Land use rights |
|
|
— |
|
||||||||||
Patents and trademarks |
|
|
— |
|
|
— |
||||||||
Total |
$ |
|
$ |
|
$ |
— |
$ |
|
||||||
Amortization expense for intangible assets for the years ended December 31, 2024, 2023 and 2022 was $
Impairment of Trademarks and Trade Names
As part of our interim impairment assessment as of June 30, 2024 described further above, we recorded a $
Expected future amortization of intangible assets as of December 31, 2024 is as follows (in thousands):
Years Ending December 31, |
|
Amount |
|
2025 |
|
|
|
2026 |
|
|
|
2027 |
|
|
|
2028 |
|
|
|
2029 |
|
|
|
Thereafter |
|
|
|
$ |
|
||
Note 11. Accrued Compensation and Related Expenses
Accrued compensation and related expenses consist of the following (in thousands):
December 31, |
December 31, |
|||||
2024 |
2023 |
|||||
Accrued salaries and wages |
|
$ |
|
|
$ |
|
Accrued paid time off |
|
|
|
|
||
$ |
|
$ |
|
|||
F-32
Note 12. Convertible Senior Notes
Convertible Senior Notes payable consisted of the following at December 31, 2024 and 2023 (in thousands):
December 31, |
||||||
|
2024 |
|
2023 |
|||
Principal amount of 2025 Senior Notes |
$ |
|
$ |
|
||
Principal amount of 2026 Senior Notes |
|
|
|
|
||
Less: unamortized debt issuance costs |
( |
( |
||||
Total carrying value of Convertible Senior Notes, net |
$ |
|
$ |
|
||
Less: current portion of carrying value of Convertible Senior Notes, net |
( |
— |
||||
Total carrying value of Convertible Senior Notes, net - long-term |
$ |
|
$ |
|
||
Interest expense incurred in connection with the Convertible Senior Notes consisted of the following for the years ended December 31, 2024, 2023 and 2022 (in thousands):
|
|||||||||
December 31, |
|||||||||
|
2024 |
|
2023 |
|
2022 |
||||
Coupon interest |
$ |
|
$ |
|
$ |
|
|||
Amortization of debt issuance costs |
|
|
|
|
|||||
Total interest expense on Convertible Senior Notes |
$ |
|
$ |
|
$ |
|
|||
The Company’s 2025 Convertible Senior Notes and 2026 Convertible Senior Notes payable of $
2026 Convertible Senior Notes
On November 12, 2021, the Company issued $
Noteholders may convert their 2026 Convertible Senior Notes at their option into shares of the Company’s common stock in the following circumstances: (1) before the close of business on the business day immediately before September 1, 2026, noteholders have the right to convert their 2026 Convertible Senior Notes only upon the occurrence of certain events (e.g., if sale price per share of the Company’s common stock exceeds
F-33
shares of the Company’s common stock based on the initial conversion rate of
The 2026 Convertible Senior Notes will be redeemable, in whole or in part (subject to certain limitations described below), at the Company’s option at any time, and from time to time, on or after December 6, 2024 and on or before the 41st scheduled trading day immediately before the maturity date, at a cash redemption price equal to the principal amount of the 2026 Convertible Senior Notes to be redeemed, plus accrued and unpaid interest, if any, to, but excluding, the redemption date, but only if certain liquidity conditions are satisfied and the last reported sale price per share of the Company’s common stock exceeds
The 2026 Convertible Senior Notes contain customary terms and events of default. If an event of default involving bankruptcy, insolvency, or reorganization events with respect to the Company (and not solely with respect to a significant subsidiary of the Company) occurs, then the principal amount of, and all accrued and unpaid interest on, the 2026 Convertible Senior Notes then outstanding will immediately become due and payable without any further action or notice by any person. If any other event of default (as defined in the 2026 Indenture) occurs and is continuing, then, the Trustee, by notice to the Company, or holders of at least
The 2026 Convertible Senior Notes were accounted for in accordance with ASC 470-20, Debt with Conversion and Other Options (“ASC 470-20”) and ASC 815-40, Contracts in Entity’s Own Equity (“ASC 815-40”). Under ASC 815-40, to qualify for equity classification (or nonbifurcation, if embedded) the instrument (or embedded feature) must be both (1) indexed to the issuer’s stock and (2) meet the requirements of the equity classification guidance. Based upon the Company’s analysis, it was determined the 2026 Convertible Senior Notes contained embedded features indexed to its own stock, but did not meet the requirements for bifurcation and recognition as derivatives, and therefore did not need to be separately recognized. Accordingly, the proceeds received from the issuance of the 2026 Convertible Senior Notes were recorded as a single liability measured at amortized cost on the consolidated balance sheets.
The Company incurred approximately $
In September 2023, the Company entered into separate, privately negotiated transactions with certain holders of the 2026 Convertible Senior Notes to repurchase $
F-34
debt on its consolidated statement of operations for the year ended December 31, 2023, which includes the write off of $
In May 2024, July 2024 and August 2024, the Company entered into separate, privately negotiated transactions with certain holders of the 2026 Convertible Senior Notes to repurchase $
Following these repurchases, approximately $
2025 Convertible Senior Notes
In May 2020, the Company issued $
At any time before the close of business on the scheduled trading day immediately before the maturity date, holders of the 2025 Convertible Senior Notes may convert their 2025 Convertible Senior Notes at their option into shares of the Company’s common stock. The 2025 Convertible Senior Notes were initially convertible into approximately
On or after June 5, 2023, we may redeem the 2025 Convertible Senior Notes at our option, in whole and not in part, at a cash redemption price equal to the principal amount of the 2025 Convertible Senior Notes to be redeemed, plus accrued and unpaid interest, if any, if:
| (1) |
The last reported sale price per share of the Company’s common stock exceeds |
F-35
| (2) | A registration statement covering the resale of the shares of the Company’s common stock issuable upon conversion of the 2025 Convertible Senior Notes is effective and available for use and is expected to remain effective and available during the redemption period as of the date the redemption notice is sent. |
The 2025 Convertible Senior Notes contain customary terms and events of default. If an event of default arising out of certain events of bankruptcy, insolvency, or reorganization involving the Company or a significant subsidiary (as set forth in the 2025 Indenture) occurs with respect to the Company, the principal amount of the 2025 Convertible Senior Notes and accrued and unpaid interest, if any, will automatically become immediately due and payable. If any other event of default (as defined in the 2025 Indenture) occurs and is continuing, either the Trustee or the holders of at least
The 2025 Convertible Senior Notes were accounted for in accordance with ASC 470-20, Debt with Conversion and Other Options (“ASC 470-20”) and ASC 815-40, Contracts in Entity’s Own Equity (“ASC 815-40”). Under ASC 815-40, to qualify for equity classification (or nonbifurcation, if embedded) the instrument (or embedded feature) must be both (1) indexed to the issuer’s stock and (2) meet the requirements of the equity classification guidance. Based upon the Company’s analysis, it was determined the 2025 Convertible Senior Notes contained embedded features indexed to its own stock, but did not meet the requirements for bifurcation and recognition as derivatives, and therefore did not need to be separately recognized. Accordingly, the proceeds received from the issuance of the 2025 Convertible Senior Notes were recorded as a single liability measured at amortized cost on the consolidated balance sheets.
The Company incurred approximately $
On November 9, 2021, the Company entered into separate, privately negotiated note purchase agreements with a limited number of holders of its 2025 Convertible Senior Notes pursuant to which the Company repurchased approximately $
In connection with the issuance of the 2025 Convertible Senior Notes, the Company entered into a registration rights agreement (the “Registration Rights Agreement”) to use its best efforts to file a registration statement for the resale of the 2025 Convertible Senior Notes and the shares of the Company’s common stock issuable upon conversion of the 2025 Convertible Senior Notes, to cause the registration statement to become effective by January 31, 2021, and to keep the registration statement continuously effective for a specified period of time. In December 2020, the Company filed an automatic shelf registration statement to register the resale of the 2025 Convertible Senior Notes and the shares of the Company’s common stock issuable upon conversion of the 2025 Convertible Senior Notes, which was amended in December 2023. If the Company fails to satisfy certain of its obligations under the Registration Rights Agreement (a “Registration Default”), it will be required to pay additional interest on the 2025 Convertible Senior Notes. Such additional interest will accrue at a rate per annum equal to
F-36
December 31, 2024, the Company has not accrued any fees or expenses associated with the Registration Rights Agreement as no Registration Default exists and, therefore, it is not probable that a payment would be required.
Note 13. Notes Payable
Notes payable, bearing interest rates of
December 31, |
||||||
|
2024 |
|
2023 |
|||
Principal amount of notes payable |
|
|
|
|
||
Less: current portion of notes payable |
|
( |
|
( |
||
Notes payable – long-term |
$ |
|
$ |
|
||
Interest expense incurred in connection with the notes payable consisted of the following for the years ended December 31, 2024, 2023 and 2022 (in thousands):
December 31, |
|||||||||
|
2024 |
|
2023 |
|
2022 |
||||
Interest expense |
$ |
|
$ |
|
$ |
|
|||
Amortization of debt discount |
|
— |
|
— |
|
|
|||
Total interest expense on notes payable |
$ |
|
$ |
|
$ |
|
|||
Cell&Co Notes
In connection with the acquisition of Cell&Co, the Company assumed two notes payable totaling €
SCI JA8 Notes
In connection with the asset acquisition of SCI JA8 in October 2023, the Company assumed three notes payable totaling €
Future note payments as of December 31, 2024 were as follows (in thousands):
Years Ending December 31, |
|
Amount |
|
2025 |
$ |
|
|
2026 |
|
||
2027 |
|
|
|
2028 |
|
|
|
2029 |
|
|
|
Thereafter |
|
|
|
Total note maturities |
$ |
|
|
Note 14. Leases
The Company has operating leases for corporate offices and certain equipment. These leases have remaining lease terms of less than
F-37
The components of lease cost were as follows (in thousands):
Year Ended December 31, |
||||||||||
|
2024 |
|
2023 |
|
2022 |
|
||||
Operating lease cost |
$ |
|
$ |
|
$ |
|
||||
Finance lease cost: |
|
|||||||||
Amortization of right-of-use assets |
|
|
|
|||||||
Interest on finance lease liabilities |
|
|
|
|||||||
|
|
|
|
|||||||
Total lease cost |
$ |
|
$ |
|
$ |
|
||||
Other information related to leases was as follows (in thousands):
Supplemental Cash Flows Information |
Year Ended December 31, |
||||||||
|
2024 |
|
2023 |
|
2022 |
||||
Cash paid for amounts included in the measurement of lease liabilities: |
|
|
|
||||||
Operating cash flows from operating leases |
|
$ |
|
|
$ |
|
|
$ |
|
Operating cash flows from finance leases |
|
$ |
|
|
$ |
|
|
$ |
|
Financing cash flows from finance leases |
$ |
|
$ |
|
$ |
|
|||
Right-of-use assets obtained in exchange for lease liabilities (in thousands): |
|||||||||
Operating leases |
|
$ |
|
|
$ |
|
|
$ |
|
Finance leases |
$ |
|
$ |
|
$ |
|
|||
December 31, |
|
||||
|
2024 |
|
2023 |
|
|
Weighted-Average Remaining Lease Term |
|
|
|||
Operating leases |
|
|
|||
Finance leases |
|
|
|||
Weighted-Average Discount Rate |
|
|
|
|
|
Operating leases |
|
% |
% |
||
Finance leases |
|
% |
% |
||
Future minimum lease payments under non-cancellable leases that have commenced as of December 31, 2024 were as follows (in thousands):
Operating |
Finance |
|||||
Years Ending December 31 |
|
Leases |
|
Leases |
||
2025 |
|
$ |
|
|
$ |
|
2026 |
|
|
|
|
||
2027 |
|
|
|
|
||
2028 |
|
|
|
|
||
2029 |
|
|
||||
Thereafter |
|
|
|
— |
||
Total future minimum lease payments |
|
|
|
|
||
Less: imputed interest |
|
( |
|
( |
||
Total |
$ |
|
$ |
|
||
Operating |
Finance |
|||||
Reported as of December 31, 2024 |
|
Leases |
|
Leases |
||
Current lease liabilities |
$ |
|
$ |
|
||
Noncurrent lease liabilities |
|
|
|
|
||
Total |
$ |
|
$ |
|
||
F-38
Note 15. Employee Benefit Plans
401(k) Plan
The Company provides a 401(k) Plan to provide retirement and incidental benefits for our eligible U.S. based employees. Employees may contribute up to
Non-U.S. Employee Benefit Plans
Eligible employees outside the U.S. generally receive retirement benefits under various defined benefit plans and defined contribution plans based upon factors such as years of service and employee compensation levels. Eligibility is generally determined in accordance with local statutory requirements. The employee benefit plan costs and liabilities regarding the defined benefit plans are determined by actuarial valuations.
Employees of the Company who are in India participate in an employee benefit plan (the “Gratuity Plan”), which is required by local law and provides a lump sum payment to vested employees upon retirement, death, incapacitation, or termination of employment based on the respective employee’s salary and the tenure of employment. The benefit costs and liabilities regarding the Gratuity Plan are determined by actuarial valuations. The Company makes annual contributions to the employees’ gratuity fund established with Life Insurance Corporation of India, which calculates the annual contribution required to be made by the Company and manages the Gratuity Plan, including any required payouts. The Gratuity Plan is partially funded. The obligation under the Gratuity Plan is not significant at December 31, 2024.
Benefit costs associated with the non-U.S. employee benefit plans totaled $
Note 16. Commitments and Contingencies
MVE Biological Solutions Fire
On January 25, 2022, a fire occurred at the MVE Biological Solutions manufacturing facility (“New Prague fire”) located in New Prague, Minnesota. The New Prague facility manufactures aluminum dewars and is one of MVE Biological Solutions’ three global manufacturing facilities. There were no injuries reported and damage was limited to a portion of the facility. As a consequence of the fire damage, the New Prague manufacturing operations were curtailed on an interim basis until the necessary repairs were completed. Production was resumed at the facility during the week of February 14, 2022 and ramped up production toward the end of the first quarter of 2022. The Company estimated that the revenue impact of the New Prague fire was approximately $
The New Prague fire resulted in a loss of inventory, fixed assets, and other contents at the site. We have adequate property damage and business interruption insurance under which we filed a claim with the insurance carrier. The Company received $
For the years ended December 31, 2023 and 2022, the Company recognized gains of $
F-39
Facility and Equipment Leases
We lease various principal facilities which include corporate, global logistics and supply chain centers, biostorage, manufacturing, and research and development facilities under operating leases in the United States, including in Tennessee, California, New Jersey, Texas, and Georgia, and internationally in the Netherlands, Portugal, and France. These lease agreements contain certain scheduled annual rent increases which are accounted for on a straight-line basis. In addition, we lease certain equipment which expires through July 2028 (See Note 14).
Employment Agreements
We have entered into employment agreements with certain of our officers under which payment and benefits would become payable in the event of termination by us for any reason other than cause, or upon a change in control of our Company, or by the employee for good reason.
Litigation
The Company may become a party to product litigation in the normal course of business. The Company accrues for open claims based on its historical experience and available insurance coverage. We record a loss contingency when it is probable that a liability has been incurred and the amount of the loss can be reasonably estimated. We also disclose material contingencies when we believe a loss is not probable but reasonably possible. Accounting for contingencies requires us to use judgment related to both the likelihood of a loss and the estimate of the amount or range of loss. The outcomes of our legal proceedings are inherently unpredictable, subject to significant uncertainties, and could be material to our financial condition, results of operations, and cash flows for a particular period.
Indemnities and Guarantees
The Company has made certain indemnities and guarantees, under which it may be required to make payments to a guaranteed or indemnified party, in relation to certain actions or transactions. The guarantees and indemnities do not provide for any limitation of the maximum potential future payments the Company could be obligated to make. Historically, the Company has not been obligated nor incurred any payments for these obligations and, therefore, no liabilities have been recorded for these indemnities and guarantees in the accompanying consolidated balance sheets.
The Company indemnifies its directors, officers, employees and agents, as permitted under the laws of the States of California and Nevada. In connection with its facility and equipment leases, the Company has indemnified its lessors for certain claims arising from the use of the facilities and equipment. The duration of the guarantees and indemnities varies and is generally tied to the life of the agreements.
Note 17. Stockholders’ Equity
Authorized Stock
The Company has
F-40
Repurchase Program
In March 2022, the Company’s Board of Directors authorized a repurchase program (the “2022 Repurchase Program”) through December 31, 2025, authorizing the repurchase of common stock and/or convertible senior notes in the amount of up to $
In July 2024, May 2024 and September 2023, the Company repurchased $
In August 2024, the Company’s Board of Directors authorized a Repurchase Program through December 31, 2027, authorizing the repurchase of common stock and/or convertible senior notes in the amount of up to $
Additionally, in August 2024, the Company repurchased approximately $
There were
As of December 31, 2024, the Company has approximately $
Series C Preferred Stock
The Series C Preferred Stock ranks senior to the shares of the Company’s common stock, with respect to dividend rights and rights upon the voluntary or involuntary liquidation, dissolution, or winding up of the affairs of the Company (a “Liquidation”). The Series C Preferred Stock has the following rights, preferences and privileges:
Dividend Rights. Holders of the Series C Preferred Stock (the “Holders”) are entitled to dividends at the rate of
Liquidation Preference. Upon a Liquidation, each share of Series C Preferred Stock is entitled to receive an amount per share equal to the greater of (i) $
Conversion Features. The Series C Preferred Stock is convertible at the option of the Holders at any time into shares of common stock at a conversion price of $
F-41
Subject to certain conditions, the Company may at its option require conversion of all of the outstanding shares of the Series C Preferred Stock to common stock if, for at least
Redemption Rights. The Company may redeem the Series C Preferred Stock for cash, as follows:
Upon a “Fundamental Change” (involving a change of control or de-listing of the Company as further described in the Certificate of Designation), each Holder has the right to require the Company to redeem all or any part of the Holder’s Series C Preferred Stock for an amount equal to the Liquidation Preference plus any accrued and unpaid dividends. If the Company does not have sufficient funds legally available to pay the repurchase price, then the Company is required to (a) pay the maximum amount of the repurchase price that can be paid out of funds legally available for payment, and (b) purchase any shares of the Series C Preferred Stock not purchased because of the foregoing limitations at the repurchase price as soon as practicable after the Company is able to make such purchase out of assets legally available for the purchase of such shares. If the Company fails to pay the repurchase price in full when due, then the Company will pay dividends on such shares not repurchased at a rate of
Voting Rights. Holders of the Series C Preferred Stock are generally entitled to vote with the holders of the shares of common stock on an as-converted basis, subject to certain Nasdaq voting limitations, if applicable. Also, the consent of the Holders of a majority of the outstanding shares of the Series C Preferred Stock is required with respect to (i) amendments to the Company’s organizational documents that have an adverse effect on the Holders of the Series C Preferred Stock, and (ii) issuances by the Company of securities that are senior to, or equal in priority with, the Series C Preferred Stock. Holders of the Series C Preferred Stock have the right to nominate for election
Registration Rights. Holders of the Series C Preferred Stock have certain customary registration rights with respect to the Series C Preferred Stock and the shares of common stock into which they are converted, pursuant to the terms of a registration rights agreement. The Company is required to file within 90 days of the Closing Date and use its commercially reasonable efforts to cause to go effective as promptly as practicable, a registration statement covering the sale or distribution of common stock issued or issuable upon conversion of the Series C Preferred Stock. In December 2020, the Company filed an automatic shelf registration statement to register the resale of the common stock issued or issuable upon conversion of the Series C Preferred Stock.
Common Stock Reserved for Future Issuance
As of December 31, 2024, approximately
Exercise of stock options |
|
|
Vesting of restricted stock units |
|
|
Conversion of Series C Preferred Stock |
|
|
Conversion of convertible 2026 Senior Notes |
|
|
Conversion of convertible 2025 Senior Notes |
|
|
Total shares of common stock reserved for future issuances |
|
|
F-42
Note 18. Stock-Based Compensation
Stock Options
We have
During the years ended December 31, 2024, 2023 and 2022, we granted stock options at exercise prices equal to or greater than the quoted market price of our common stock on the grant date. The fair value of each option grant was estimated on the date of grant using Black-Scholes with the following weighted average assumptions:
December 31, |
||||||||
|
2024 |
|
2023 |
|
2022 |
|||
Expected life (years) |
||||||||
Risk-free interest rate |
|
% |
% |
|
% |
|||
Volatility |
|
% |
% |
|
% |
|||
Dividend yield |
|
|
||||||
The expected option life assumption is estimated based on the simplified method as the Company’s history is not indicative of future expected lives. Accordingly, the Company has utilized the average of the contractual term of the options and the weighted average vesting period for all options to calculate the expected option term. The risk-free interest rate assumption is based upon observed interest rates appropriate for the expected term of our employee stock options. The expected volatility is based on the average of the historical volatility and the implied volatility of our stock commensurate with the expected life of the stock-based award. We do not anticipate paying dividends on the common stock in the foreseeable future.
We recognize stock-based compensation cost on a straight-line basis over the vesting period. Stock-based compensation expense is recognized only for those awards that ultimately vest. Forfeitures are recorded when recognized.
Total stock-based compensation expense related to all of our share-based payment awards is comprised of the following (in thousands):
Year Ended December 31, |
|||||||||
|
2024 |
|
2023 |
|
2022 |
||||
Cost of revenue |
$ |
|
$ |
|
$ |
|
|||
Selling, general and administrative |
|
|
|
|
|
|
|||
Engineering and development |
|
|
|
|
|
|
|||
$ |
|
$ |
|
$ |
|
||||
F-43
A summary of stock option activity is as follows:
Weighted- |
||||||||||
Weighted- |
Average |
|||||||||
Average |
Remaining |
Aggregate |
||||||||
Number of |
Exercise |
Contractual |
Intrinsic |
|||||||
|
Shares |
|
Price/Share |
|
Term (Years) |
|
Value (1) |
|||
Outstanding — December 31, 2021 |
|
|
$ |
|
|
|
|
|
||
Granted (weighted-average fair value of $ |
|
|
|
|
|
|
|
|||
Exercised |
|
( |
|
|
|
|
|
|
||
Forfeited |
|
( |
|
|
|
|
|
|
||
Outstanding — December 31, 2022 |
|
|
|
|
|
|
|
|||
Granted (weighted-average fair value of $ |
|
|
|
|||||||
Exercised |
|
( |
|
|
|
|
|
|||
Forfeited |
|
( |
|
|
|
|
|
|||
Outstanding — December 31, 2023 |
|
$ |
|
— |
— |
|||||
Granted (weighted-average fair value of $ |
|
|
— |
— |
||||||
Exercised |
|
( |
|
|
|
— |
— |
|||
Forfeited |
( |
|
— |
— |
||||||
Outstanding — December 31, 2024 |
|
|
$ |
|
|
$ |
|
|||
Vested (exercisable) — December 31, 2024 |
|
|
$ |
|
|
$ |
|
|||
Expected to vest after December 31, 2024 (unexercisable) |
|
|
$ |
|
|
$ |
|
|||
| (1) |
Aggregate intrinsic value represents the difference between the exercise price of the option and the closing market price of the Company’s common stock on December 31, 2024, (the last trading day of the year) which was $ |
The following table summarizes information with respect to stock options outstanding and exercisable at December 31, 2024:
Weighted- |
||||||||||||
Average |
Weighted- |
Weighted- |
||||||||||
|
Remaining |
|
Average |
|
Average |
|||||||
|
Number |
|
Contractual |
|
Exercise |
|
Number |
Exercise |
||||
Exercise Price |
|
Outstanding |
|
Life -Years |
|
Price |
|
Exercisable |
|
Price |
||
$ |
|
|
|
$ |
|
|
|
$ |
|
|||
$ |
|
|
|
$ |
|
|
|
$ |
|
|||
$ |
|
|
|
$ |
|
|
|
$ |
|
|||
$ |
|
|
|
$ |
|
|
|
$ |
|
|||
$ |
|
|
|
$ |
|
|
|
$ |
|
|||
$ |
|
|
|
$ |
|
|
|
$ |
|
|||
$ |
|
|
|
$ |
|
|
|
$ |
|
|||
|
|
|
|
|||||||||
As of December 31, 2024, there was unrecognized compensation expense of $
The total intrinsic value of options exercised during the years ended December 31, 2024, 2023 and 2022 was $
F-44
Restricted Stock Units
A summary of our restricted stock unit activity is as follows:
|
|
Weighted Average |
|||
Number of Restricted |
Fair Value per |
||||
Stock Units |
Share |
||||
Outstanding — December 31, 2021 |
$ |
||||
Granted |
|||||
Share issuance |
( |
||||
Forfeited |
( |
||||
Outstanding — December 31, 2022 |
$ |
||||
Granted |
|||||
Share issuance |
( |
||||
Forfeited |
( |
||||
Outstanding — December 31, 2023 |
|
|
$ |
||
Granted |
|
|
|
|
|
Share issuance |
|
( |
|
|
|
Forfeited |
|
( |
|
|
|
Outstanding — December 31, 2024 |
|
|
$ |
|
|
For the years ended December 31, 2024, 2023 and 2022, we recorded stock-based compensation expense on our issued restricted stock units of $
Note 19. Income Taxes
Loss before provision for income taxes was attributed to the following jurisdictions for the years ended December 31, 2024, 2023 and 2022 (in thousands):
Years Ended December 31, |
|||||||||
|
2024 |
|
2023 |
|
2022 |
||||
United States |
$ |
( |
$ |
( |
$ |
( |
|||
Foreign |
|
( |
|
( |
|
( |
|||
$ |
( |
$ |
( |
$ |
( |
||||
The provision for income taxes consists of the following for the years ended December 31, 2024, 2023 and 2022 (in thousands):
Years Ended December 31, |
|||||||||
|
2024 |
|
2023 |
|
2022 |
||||
Current: |
|
|
|
|
|
|
|||
Federal |
$ |
— |
$ |
— |
$ |
— |
|||
State |
|
|
|
|
|
|
|||
Foreign |
|
|
|
|
|
|
|||
Total current expense |
|
|
|
|
|
|
|||
Deferred: |
|
|
|
|
|
|
|||
Federal |
|
( |
|
( |
|
( |
|||
State |
|
( |
|
( |
|
( |
|||
Foreign |
|
( |
|
( |
|
( |
|||
Change in valuation allowance |
|
— |
|
— |
|
|
|||
Total deferred expense |
|
( |
|
( |
|
( |
|||
Total provision for income taxes |
$ |
|
$ |
|
$ |
|
|||
F-45
Significant components of the Company’s deferred tax assets and liabilities as of December 31, 2024 and 2023 are shown below (in thousands):
December 31, |
||||||
|
2024 |
|
2023 |
|||
Deferred tax assets: |
|
|
|
|
||
Net operating loss carryforward |
$ |
|
$ |
|
||
Expenses recognized for granting of options and warrants |
|
|
|
|
||
Interest expense |
|
|
|
|
||
Unrealized losses |
|
|
|
|
||
Capitalized research & experimentation |
|
|
|
|
||
R&D tax credit |
|
|
|
|
||
Accrued expenses and reserves |
|
|
|
|
||
Goodwill |
|
|
||||
Lease liability |
|
|
|
|
||
Total deferred tax assets |
|
|
|
|
||
Valuation allowance |
|
( |
|
( |
||
$ |
|
$ |
|
|||
Deferred tax liabilities: |
|
|
|
|
||
Goodwill |
$ |
— |
$ |
— |
||
Right-of-use assets |
|
( |
|
( |
||
Intangibles |
|
( |
|
( |
||
Unremitted foreign earnings |
|
( |
|
( |
||
Total deferred tax liability |
|
( |
|
( |
||
Net deferred tax liability |
$ |
( |
$ |
( |
||
Our net deferred tax liability as presented in our consolidated balance sheet consists of the following items (in thousands):
December 31, |
||||||
|
2024 |
|
2023 |
|||
Deferred tax assets |
$ |
|
$ |
|
||
Deferred tax liabilities |
|
( |
|
( |
||
Net deferred tax liability |
$ |
( |
$ |
( |
||
The Company has recorded a net deferred tax liability in jurisdictions where taxable temporary differences from indefinite-lived intangible assets do not support the realization of deferred tax assets which have finite carryover periods. In addition, the Company has recorded a net deferred tax liability in jurisdictions where taxable temporary differences exceed deductible temporary differences.
F-46
The provision for (benefit from) income taxes differs from that computed using the federal statutory rate applied to loss before provision for income taxes as follows (in thousands):
December 31, |
|||||||||
|
2024 |
|
2023 |
|
2022 |
||||
Computed tax benefit at federal statutory rate |
$ |
( |
$ |
( |
$ |
( |
|||
State tax, net of federal benefit |
|
( |
|
( |
|
|
|||
Non-deductible loss on debt extinguishment |
|
— |
|
— |
|
— |
|||
Stock compensation |
|
|
|
|
|
|
|||
Deemed foreign dividend income |
|
|
|
|
|
— |
|||
R&D tax credit |
|
( |
|
( |
|
( |
|||
Permanent differences and other |
|
|
|
( |
|
|
|||
Transaction cost |
|
( |
|
|
|
|
|||
Executive compensation |
|
|
|
|
|
|
|||
Rate changes |
|
( |
|
( |
|
( |
|||
Impairment of goodwill |
|
|
— |
||||||
Contingencies |
|
|
|
( |
|
( |
|||
Valuation allowance |
|
|
|
|
|
|
|||
$ |
|
$ |
|
$ |
|
||||
At December 31, 2024, the Company has federal and state net operating loss carryforwards of approximately $
Utilization of the net operating loss (“NOL”) and research and development (“R&D”) carryforwards might be subject to a substantial annual limitation due to ownership change limitations that may have occurred or that could occur in the future, as required by Section 382 of the Internal Revenue Code of 1986, as amended (the “Code”), as well as similar state and foreign provisions. These ownership changes may limit the amount of NOL and R&D credit carryforwards that can be utilized annually to offset future taxable income and tax, respectively. In general, an “ownership change” as defined by Section 382 of the Code results from a transaction or series of transactions over a three-year period resulting in an ownership change of more than 50 percentage points of the outstanding stock of a company by certain stockholders or public groups. Since the Company’s formation, the Company has raised capital through the issuance of capital stock on several occasions which, combined with the purchasing stockholders’ subsequent disposition of those shares, may have resulted in such an ownership change, or could result in an ownership change in the future upon subsequent capital stock transactions.
The Company has not completed a study to assess whether an ownership change or changes has occurred. If the Company has experienced an ownership change, utilization of the NOL or R&D credit carryforwards would be subject to an annual limitation under Section 382 of the Code, which is determined by first multiplying the value of the Company’s stock at the time of the ownership change by the applicable long-term tax-exempt rate. Any limitation may result in expiration of a portion of the NOL or R&D credit carryforwards before utilization. Further, until a study is completed and any limitation is known, no amounts are being considered as an uncertain tax position or disclosed as an unrecognized tax benefit. Due to the existence of the valuation allowance, future changes in the Company’s unrecognized tax benefits will not impact its effective tax rate. Any carryforwards that will expire prior to utilization as a result of such limitations will be removed from deferred tax assets with a corresponding reduction of the valuation allowance.
F-47
A reconciliation of the beginning and ending amounts of unrecognized tax positions are as follows (in thousands):
December 31, |
|||||||||
|
2024 |
|
2023 |
|
2022 |
||||
Unrecognized tax positions, beginning of period |
$ |
|
$ |
|
$ |
|
|||
Gross increase – current period tax positions |
|
|
|
|
|
|
|||
Gross decrease – prior period tax positions |
|
— |
|
( |
|
( |
|||
Gross increase – prior period tax positions |
|
|
|
— |
|
— |
|||
Expiration of statute of limitations |
|
— |
|
— |
|
— |
|||
Unrecognized tax positions, end of period |
$ |
|
$ |
|
$ |
|
|||
If recognized, none of the unrecognized tax positions would impact the Company’s income tax benefit or effective tax rate as long as the Company’s deferred tax assets remain subject to a full valuation allowance. The Company does not expect any significant increases or decreases to the Company’s unrecognized tax positions within the next 12 months.
We recognize interest accrued related to unrecognized tax benefits (“UTBs”) and penalties as income tax expense. As of December 31, 2024, we have an immaterial accrual for interest in our consolidated balance sheet.
Due to the NOL carryforwards, the U.S. federal and state returns remain open to examination by the Internal Revenue Service and state taxing jurisdictions for all years beginning with the year ended March 31, 2005. Our foreign subsidiaries are generally subject to examination three years following the year on which the tax obligation originated. The years subject to audit may be extended if the entity substantially understates corporate income tax. The Company’s subsidiary in India is currently under examination by the Office of the Commissioner of Income Tax in India for the 2012-2013, 2013-2014 and 2015-2016 tax periods. Other than India, the Company does not have any foreign subsidiaries currently under audit by their local income tax authorities.
Note 20. Segment Reporting
Operating segments are identified as components of an enterprise about which separate discrete financial information is available for evaluation by the chief operating decision maker in making decisions regarding resource allocation and assessing performance. The chief operating decision maker is our Chief Executive Officer.
Effective in the fourth quarter of 2024, the Company realigned the reportable segment information that the CODM regularly reviews to evaluate the business, make key operating decisions and allocate resources which resulted in the identification of
Adjusted earnings before interest, income taxes, depreciation and amortization (“adjusted EBITDA”) for each operating segment is the profit measure used by the CODM in measuring the performs of the business and in the annual budget and forecasting process. Adjusted EBITDA is defined by the Company as earnings before interest, income taxes, depreciation, amortization and certain items that do not contribute directly to management’s evaluation of its operating results. Asset information by reportable segment is not provided to the CODM.
We have
In addition, the CODM manages and evaluates the operating performance of the segments, as described above, on a pre-corporate cost allocation basis. Accordingly, for segment reporting purposes, the company does not allocate corporate costs, which include certain aspects of the Company’s executive management, legal, compliance, human resources, information technology and finance departments, to its reportable segments.
F-48
Information about our segments is as follows (in thousands):
Year Ended December 31, 2024 |
Year Ended December 31, 2023 |
Year Ended December 31, 2022 |
|||||||||||||||||||||||||
|
Life Sciences Services |
|
Life Sciences Products |
|
Total |
|
Life Sciences Services |
|
Life Sciences Products |
|
Total |
Life Sciences Services |
|
Life Sciences Products |
|
Total |
|||||||||||
Revenue from external customers 1 |
$ |
|
$ |
|
$ |
|
$ |
|
$ |
|
$ |
|
$ |
|
$ |
|
$ |
|
|||||||||
Intersegment revenue |
|
|
|
|
|
|
|
|
|
|
|
|
|
|
|
|
|
|
|||||||||
|
|
|
|
|
|
|
|
|
|||||||||||||||||||
Reconciliation of revenue |
|||||||||||||||||||||||||||
Elimination of intersegment revenue |
( |
( |
( |
||||||||||||||||||||||||
Total consolidated revenue |
|
|
|
||||||||||||||||||||||||
Less: |
|||||||||||||||||||||||||||
Cost of revenue 1, 2 |
|
|
|
|
|
|
|||||||||||||||||||||
Employee related expenses |
|
|
|
|
|
|
|||||||||||||||||||||
Engineering and development expense 3 |
|
|
|
|
|
|
|||||||||||||||||||||
Rent |
|
|
|
|
|
|
|||||||||||||||||||||
Other segment items 4 |
|
|
|
|
|
|
|||||||||||||||||||||
Adjusted EBITDA for reportable segments |
$ |
( |
$ |
|
$ |
|
$ |
( |
$ |
|
$ |
|
$ |
( |
$ |
|
$ |
|
|||||||||
Corporate overhead costs |
( |
( |
( |
||||||||||||||||||||||||
Depreciation and amortization expense |
( |
( |
( |
||||||||||||||||||||||||
Acquisition and integration costs |
( |
( |
( |
||||||||||||||||||||||||
Cost reduction initiatives |
( |
- |
- |
||||||||||||||||||||||||
Investment income |
|
|
|
||||||||||||||||||||||||
Unrealized (gain)/loss on investments |
( |
|
( |
||||||||||||||||||||||||
Gain on insurance claim |
- |
|
|
||||||||||||||||||||||||
Other non-recurring costs |
- |
( |
- |
||||||||||||||||||||||||
Foreign currency (gain)/loss |
( |
|
|
||||||||||||||||||||||||
Interest expense, net |
( |
( |
( |
||||||||||||||||||||||||
Gain on extinguishment of debt, net |
|
|
- |
||||||||||||||||||||||||
Impairment loss |
( |
( |
- |
||||||||||||||||||||||||
Change in fair value of contingent consideration |
|
|
( |
||||||||||||||||||||||||
Stock-based compensation expense |
( |
( |
( |
||||||||||||||||||||||||
Income taxes |
( |
( |
( |
||||||||||||||||||||||||
Net loss |
$ |
( |
$ |
( |
$ |
( |
|||||||||||||||||||||
(1) Life Sciences Services segment includes immaterial revenue from external customers and cost of revenue associated with life sciences products revenue and cost of products revenue, respectively.
(2) Cost of revenue is exclusive of employee related expenses of $
(3) Engineering and development expense is exclusive of employee related expenses of $
(4)
F-49