EXHIBIT 99.1
Published on January 19, 2021
Exhibit 99.1
© 2021 Cryoport, Inc. All Rights Reserved CYRX: NASDAQ
© 2021 Cryoport, Inc. All Rights Reserved Forward Looking Statements Statements in this presentation and statements made orally during this presentation are not purely historical, including statements regarding Cryoport’s intentions, hopes, beliefs, expectations, representations, projections, plans or predictions of the future are forward - looking statements within the meaning of the Private Securities Litigation Reform Act of 1995 . Words or phrases such as “believe,” “may,” “could,” “will,” “estimate,” “continue,” “anticipate,” “intend,” “seek,” “plan,” “expect,” “should,” “would” or similar expressions are intended to identify forward - looking statements . Forward - looking statements are based on current beliefs and assumptions that are subject to risks and uncertainties . These forward - looking statements include, but are not limited to, statements concerning the potential benefit of Cryoport’s acquisitions of CRYOPDP and MVE and the estimated or anticipated future business, performance and results of operations following the transaction . It is important to note that Cryoport’s actual results could differ materially from those in any such forward - looking statements . Factors that could cause actual results to differ materially include, but are not limited to, ( 1 ) risks and uncertainties associated with the effect of changing economic conditions, ( 6 ) trends in the products markets, ( 7 ) variations in Cryoport’s cash flow, ( 8 ) market acceptance risks, ( 9 ) technical development risks and ( 10 ) other unforeseen risks . Cryoport’s business could be affected by a number of other factors, including the risk factors listed from time to time in Cryoport’s SEC reports including, but not limited to, Cryoport’s 10 - K for the year ended December 31 , 2019 , Cryoport’s Quarterly Report on Form 10 - Q for the quarter ended September 30 , 2020 and any subsequent filings with the SEC . Cryoport cautions you not to place undue reliance on the forward - looking statements contained in this presentation, which only speak as of the date hereof . Except as required by law, Cryoport disclaims any obligation, and does not undertake, to update or revise any forward - looking statements . This presentation includes Adjusted EBITDA, a non - GAAP financial measure . Cryoport defines Adjusted EBITDA as net income (loss), as adjusted for depreciation and amortization expense, interest expense, net, stock - based compensation expense, income taxes and acquisition costs . Adjusted EBITDA is in addition to and not a substitute for or superior to measures of financial performance prepared in accordance with GAAP and should not be considered as an alternative to revenue, net income, operating income or any other performance measures derived in accordance with GAAP . A reconciliation of Adjusted EBITDA to its most directly comparable GAAP counterpart, net income (loss), included in this presentation . Cryoport believes this non - GAAP measure provides a useful measure of the Company’s operating results, a meaningful comparison with historical results and with the results of other companies, and insight into the Company’s ongoing operating performance . Further, management and the Board of Directors utilize this non - GAAP financial measure to gain a better understanding of the Company's comparative operating performance from period - to - period and as a basis for planning and forecasting future periods . However, there are a number of limitations related to the use of these or other non - GAAP measures and their nearest GAAP equivalents . For example, other companies may calculate non - GAAP measures differently, or may use other measures to calculate their financial performance and therefor Cryoport’s measure of Adjusted EBITDA may not be directly comparable to similarly titled measures of other companies . 2
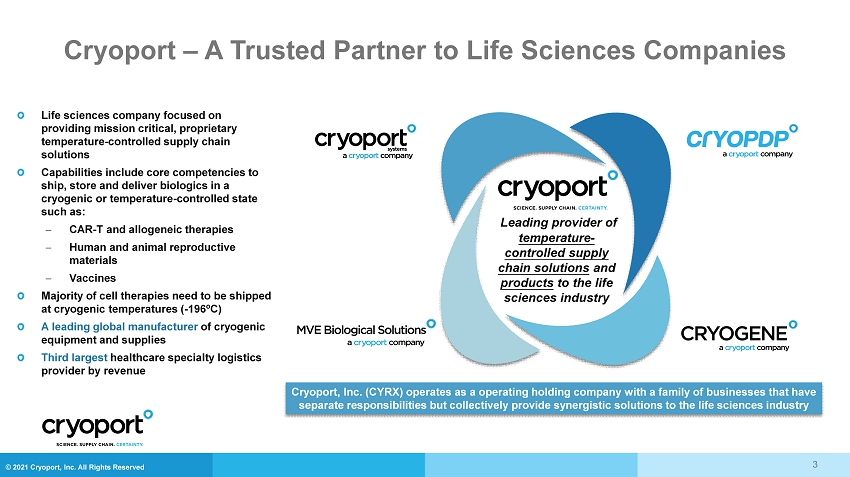
© 2021 Cryoport, Inc. All Rights Reserved Life sciences company focused on providing mission critical, proprietary temperature - controlled supply chain solutions Capabilities include core competencies to ship, store and deliver biologics in a cryogenic or temperature - controlled state such as: CAR - T and allogeneic therapies Human and animal reproductive materials Vaccines Majority of cell therapies need to be shipped at cryogenic temperatures ( - 196ºC) A leading global manufacturer of cryogenic equipment and supplies Third largest healthcare specialty logistics provider by revenue Leading provider of temperature - controlled supply chain solutions and products to the life sciences industry Cryoport , Inc. (CYRX) operates as a operating holding company with a family of businesses that have separate responsibilities but collectively provide synergistic solutions to the life sciences industry Cryoport – A Trusted Partner to Life Sciences Companies 3
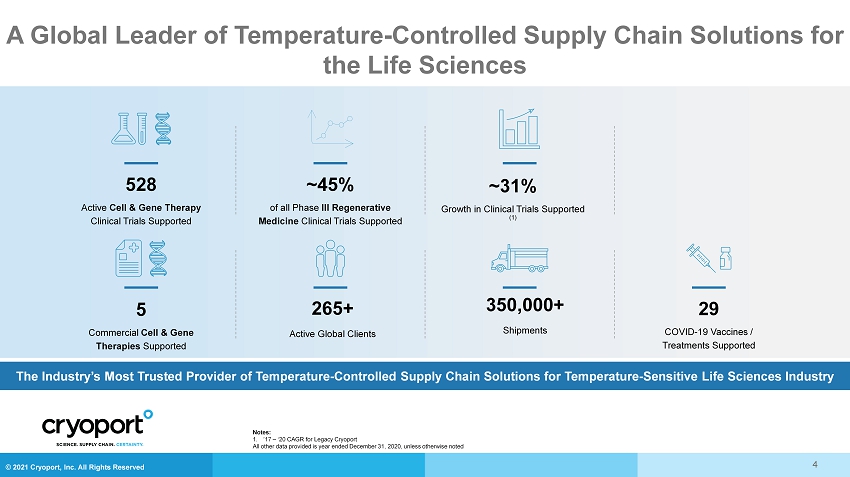
© 2021 Cryoport, Inc. All Rights Reserved A Global Leader of Temperature - Controlled Supply Chain Solutions for the Life Sciences The Industry’s Most Trusted Provider of Temperature - Controlled Supply Chain Solutions for Temperature - Sensitive Life Sciences In dustry ~45% of all Phase III Regenerative Medicine Clinical Trials Supported 265+ Active Global Clients 29 COVID - 19 Vaccines / Treatments Supported ~31% Growth in Clinical Trials Supported (1) 350,000+ Shipments 528 Active Cell & Gene Therapy Clinical Trials Supported 5 Commercial Cell & Gene Therapies Supported 4 Notes: 1. ’17 – ‘20 CAGR for Legacy Cryoport All other data provided is year ended December 31, 2020, unless otherwise noted
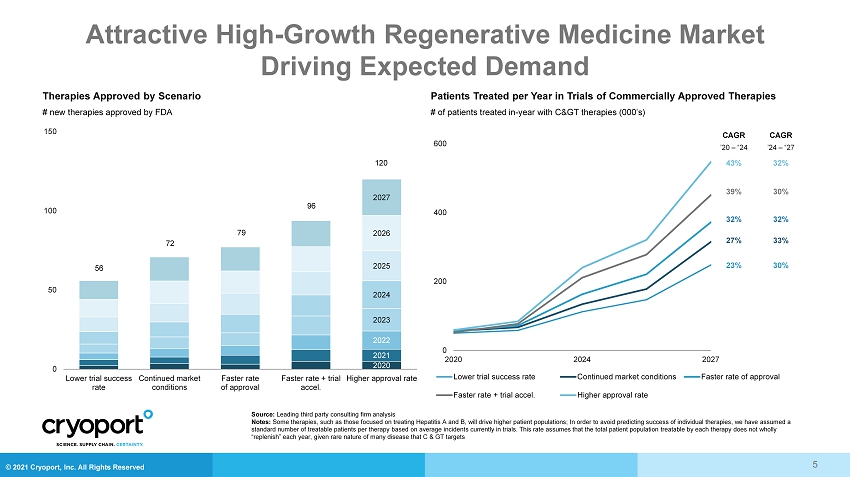
© 2021 Cryoport, Inc. All Rights Reserved Attractive High - Growth Regenerative Medicine Market Driving Expected Demand Patients Treated per Year in Trials of Commercially Approved Therapies Therapies Approved by Scenario # of patients treated in - year with C> therapies (000’s) # new therapies approved by FDA 2020 2021 2022 2023 2024 2025 2026 2027 0 50 100 150 Lower trial success rate Continued market conditions Faster rate of approval Faster rate + trial accel. Higher approval rate 0 200 400 600 2020 2024 2027 Lower trial success rate Continued market conditions Faster rate of approval Faster rate + trial accel. Higher approval rate CAGR ’20 – “24 43% 39% 32% 27% 23% CAGR ’24 – “27 32% 30% 32% 33% 30% 56 72 79 96 120 Source: Leading third party consulting firm analysis Notes: Some therapies, such as those focused on treating Hepatitis A and B, will drive higher patient populations; In order to avoid pr edicting success of individual therapies, we have assumed a standard number of treatable patients per therapy based on average incidents currently in trials. This rate assumes that the tot al patient population treatable by each therapy does not wholly “replenish” each year, given rare nature of many disease that C & GT targets 5
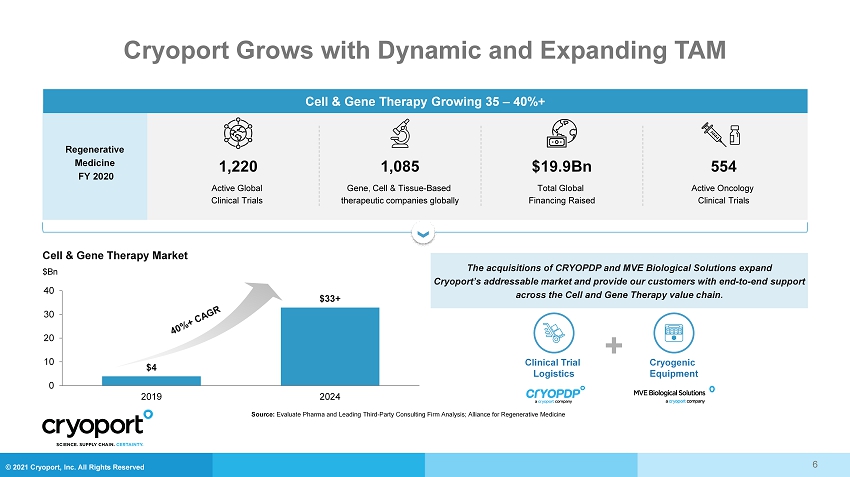
© 2021 Cryoport, Inc. All Rights Reserved Cryoport Grows with Dynamic and Expanding TAM Regenerative Medicine FY 2020 Cell & Gene Therapy Growing 35 – 40%+ Active Oncology Clinical Trials Total Global Financing Raised Gene, Cell & Tissue - Based therapeutic companies globally Active Global Clinical Trials Cell & Gene Therapy Market $Bn $4 $33+ 0 10 20 30 40 2019 2024 The acquisitions of CRYOPDP and MVE Biological Solutions expand Cryoport’s addressable market and provide our customers with end - to - end support across the Cell and Gene Therapy value chain. Clinical Trial Logistics + Cryogenic Equipment Source: Evaluate Pharma and Leading Third - Party Consulting Firm Analysis; Alliance for Regenerative Medicine 6 1,220 1,085 $19.9Bn 554
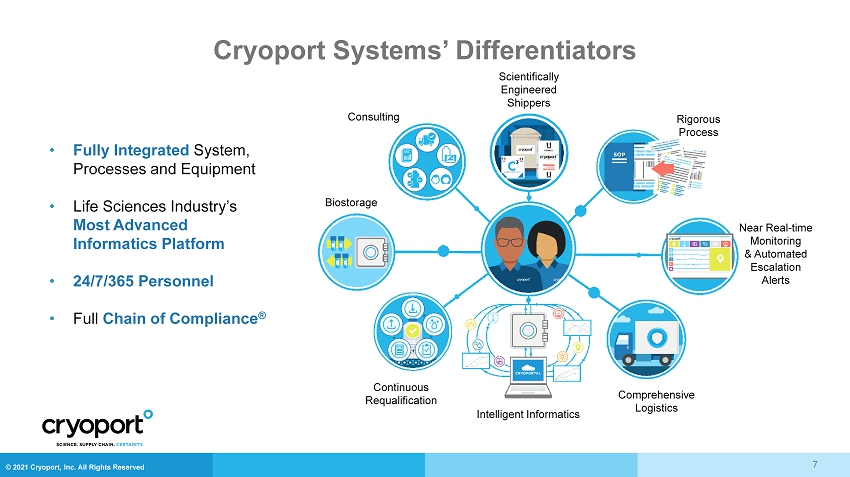
© 2021 Cryoport, Inc. All Rights Reserved Cryoport Systems’ Differentiators • Fully Integrated System, Processes and Equipment • Life Sciences Industry’s Most Advanced Informatics Platform • 24/7/365 Personnel • Full Chain of Compliance ® Scientifically Engineered Shippers Near Real - time Monitoring & Automated Escalation Alerts Biostorage Continuous Requalification Comprehensive Logistics Consulting Rigorous Process Intelligent Informatics 7
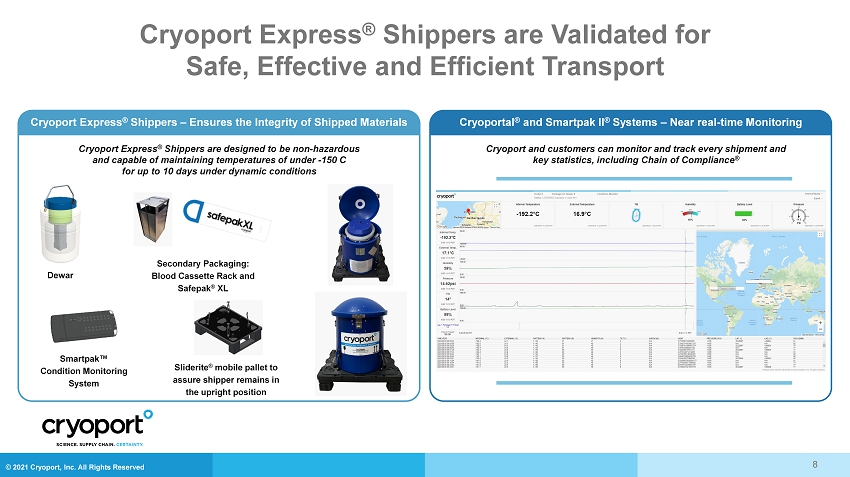
© 2021 Cryoport, Inc. All Rights Reserved Cryoport Express ® Shippers are Validated for Safe, Effective and Efficient Transport 8 Cryoport Express ® Shippers are designed to be non - hazardous and capable of maintaining temperatures of under - 150 C for up to 10 days under dynamic conditions Smartpak™ Condition Monitoring System Sliderite ® mobile pallet to assure shipper remains in the upright position Dewar Secondary Packaging: Blood Cassette Rack and Safepak ® XL Cryoport Express ® Shippers – Ensures the Integrity of Shipped Materials Cryoportal ® and Smartpak II ® Systems – Near real - time Monitoring Cryoport and customers can monitor and track every shipment and key statistics, including Chain of Compliance ®
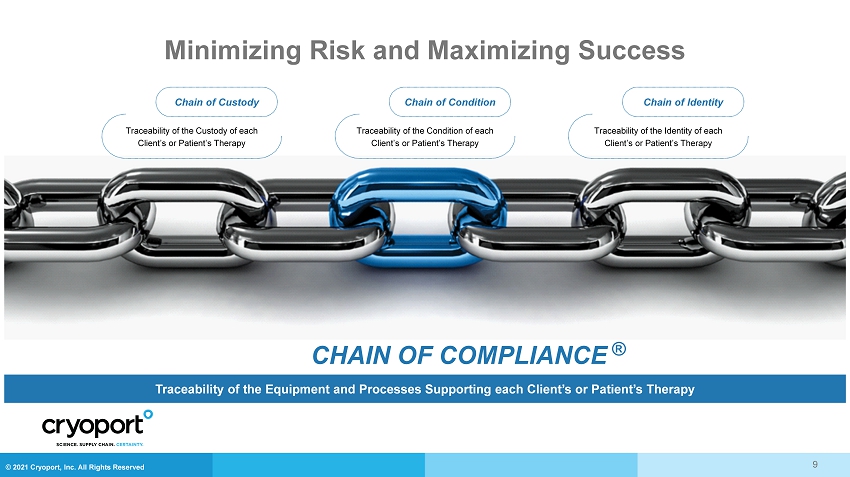
© 2021 Cryoport, Inc. All Rights Reserved Minimizing Risk and Maximizing Success CHAIN OF COMPLIANCE ® Traceability of the Equipment and Processes Supporting each Client’s or Patient’s Therapy Chain of Custody Traceability of the Custody of each Client’s or Patient’s Therapy Chain of Condition Traceability of the Condition of each Client’s or Patient’s Therapy Chain of Identity Traceability of the Identity of each Client’s or Patient’s Therapy 9
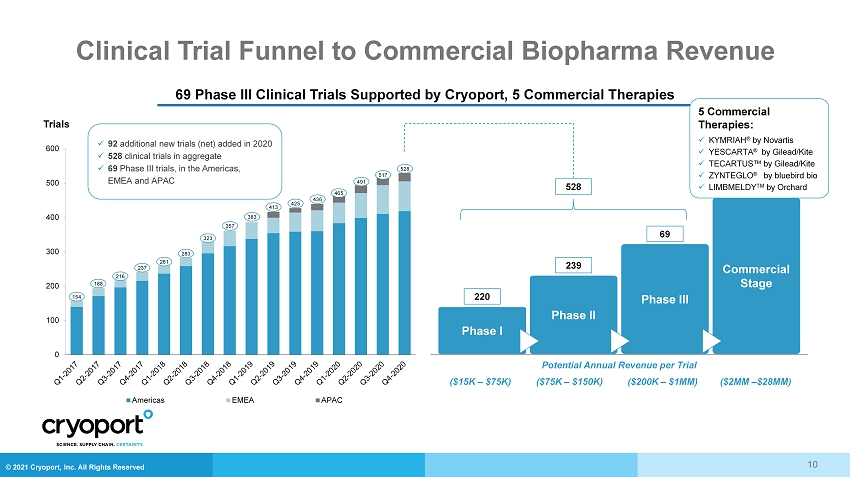
© 2021 Cryoport, Inc. All Rights Reserved Clinical Trial Funnel to Commercial Biopharma Revenue 10 69 Phase III Clinical Trials Supported by Cryoport, 5 Commercial Therapies Trials 0 100 200 300 400 500 600 Americas EMEA APAC x 92 additional new trials (net) added in 2020 x 528 clinical trials in aggregate x 69 Phase III trials, in the Americas, EMEA and APAC 154 188 216 237 261 283 323 357 383 413 425 436 465 491 517 528 Commercial Stage Phase II Phase III Phase I 220 239 69 528 Potential Annual Revenue per Trial ($15K – $75K) ($75K – $150K) ($200K – $1MM) ($2MM – $28MM) 5 Commercial Therapies: x KYMRIAH ® by Novartis x YESCARTA ® by Gilead/Kite x TECARTUS™ by Gilead/Kite x ZYNTEGLO ® by bluebird bio x LIMBMELDY TM by Orchard
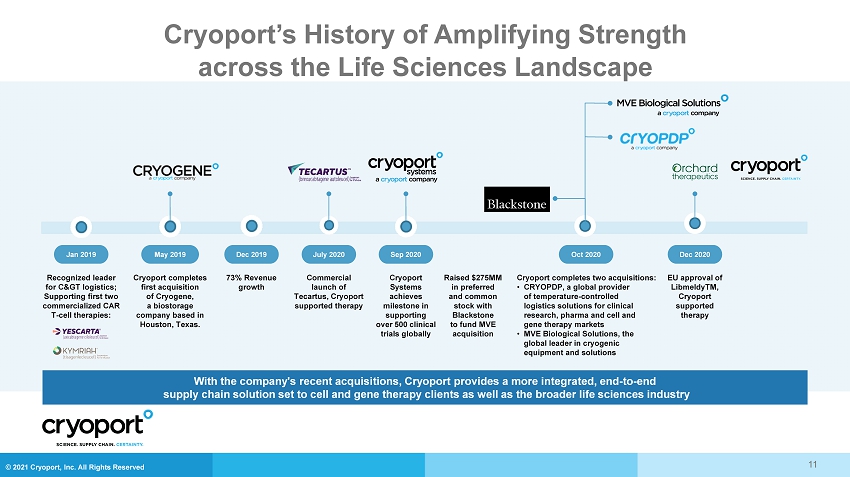
© 2021 Cryoport, Inc. All Rights Reserved 11 With the company's recent acquisitions, Cryoport provides a more integrated, end - to - end supply chain solution set to cell and gene therapy clients as well as the broader life sciences industry Raised $275MM in preferred and common stock with Blackstone to fund MVE acquisition Sep 2020 Cryoport Systems achieves milestone in supporting over 500 clinical trials globally May 2019 Cryoport completes first acquisition of Cryogene, a biostorage company based in Houston, Texas. Dec 2019 73% Revenue growth Jan 2019 Recognized leader for C> logistics; Supporting first two commercialized CAR T - cell therapies: Commercial launch of Tecartus, Cryoport supported therapy July 2020 Oct 2020 Cryoport completes two acquisitions: • CRYOPDP, a global provider of temperature - controlled logistics solutions for clinical research, pharma and cell and gene therapy markets • MVE Biological Solutions, the global leader in cryogenic equipment and solutions Dec 2020 EU approval of LibmeldyTM, Cryoport supported therapy Cryoport’s History of Amplifying Strength across the Life Sciences Landscape
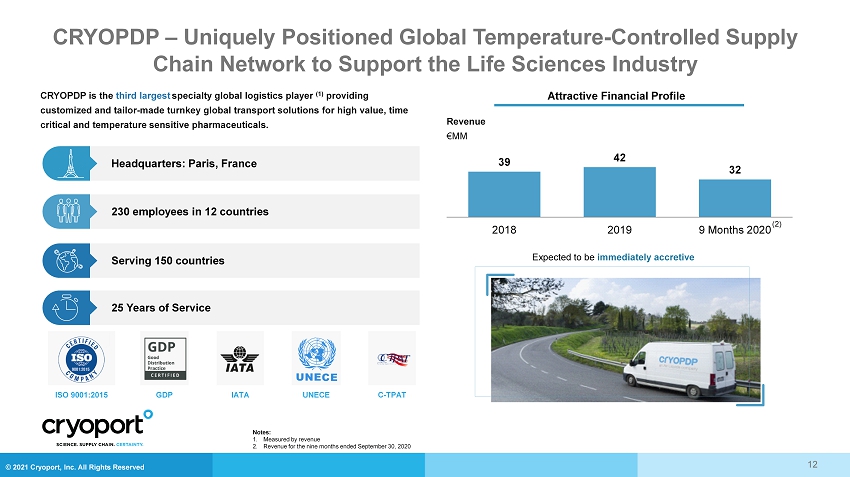
© 2021 Cryoport, Inc. All Rights Reserved CRYOPDP – Uniquely Positioned Global Temperature - Controlled Supply Chain Network to Support the Life Sciences Industry 25 Years of Service Serving 150 countries Headquarters: Paris, France 230 employees in 12 countries CRYOPDP is the third largest specialty global logistics player (1) providing customized and tailor - made turnkey global transport solutions for high value, time critical and temperature sensitive pharmaceuticals. ISO 9001:2015 GDP IATA UNECE C - TPAT Attractive Financial Profile Revenue €MM 39 42 32 2018 2019 9 Months 2020 Expected to be immediately accretive 12 (2) Notes: 1. Measured by revenue 2. Revenue for the nine months ended September 30, 2020
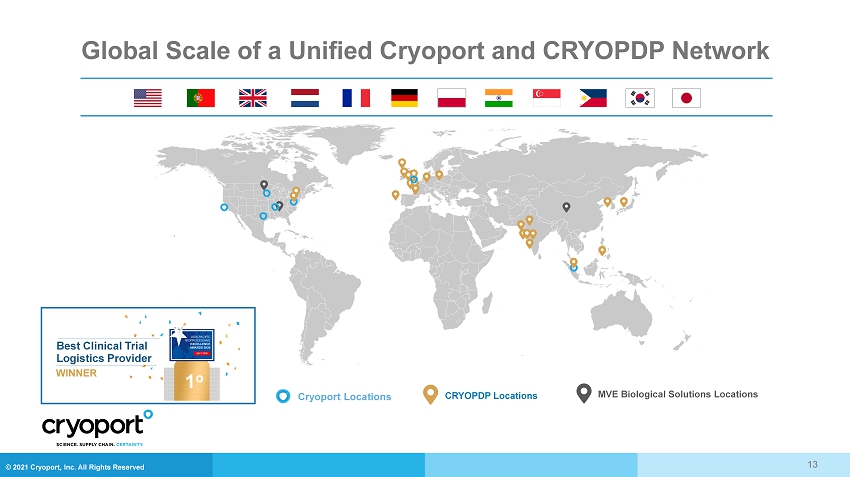
© 2021 Cryoport, Inc. All Rights Reserved Global Scale of a Unified Cryoport and CRYOPDP Network Best Clinical Trial Logistics Provider WINNER 1 o Cryoport Locations CRYOPDP Locations MVE Biological Solutions Locations 13
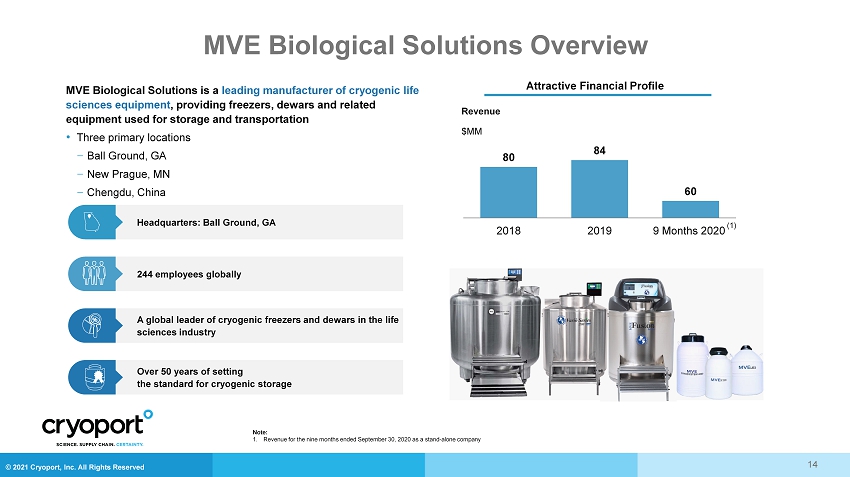
© 2021 Cryoport, Inc. All Rights Reserved MVE Biological Solutions Overview Over 50 years of setting the standard for cryogenic storage A global leader of cryogenic freezers and dewars in the life sciences industry Headquarters: Ball Ground, GA 244 employees globally MVE Biological Solutions is a leading manufacturer of cryogenic life sciences equipment , providing freezers, dewars and related equipment used for storage and transportation • Three primary locations ‒ Ball Ground, GA ‒ New Prague, MN ‒ Chengdu, China Revenue $MM 80 84 60 2018 2019 9 Months 2020 14 Attractive Financial Profile Note: 1. Revenue for the nine months ended September 30, 2020 as a stand - alone company (1)
© 2021 Cryoport, Inc. All Rights Reserved Current Cell & Gene Therapy Pipeline Driving Revenue Growth • Seven Cryoport supported Marketing Authorization Applications (MAA’s) or Biologic License Applications (BLA’s) were filed in 2020 • Anticipate up to 23 MAA or BLA submissions for Cryoport - supported products in 2021 15 Each of these therapies require comprehensive temperature - controlled supply chain services including logistics and bioservices support at scale
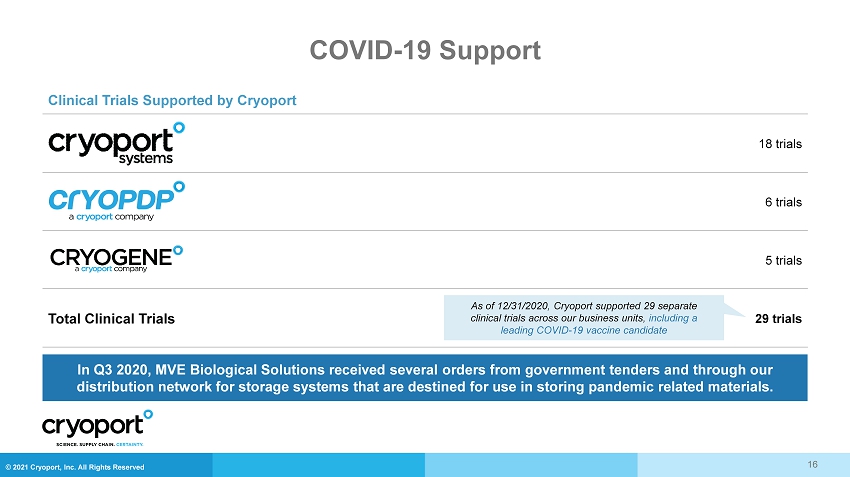
© 2021 Cryoport, Inc. All Rights Reserved COVID - 19 Support Clinical Trials Supported by Cryoport 18 trials 6 trials 5 trials Total Clinical Trials 29 trials As of 12/31/2020, Cryoport supported 29 separate clinical trials across our business units, including a leading COVID - 19 vaccine candidate In Q3 2020, MVE Biological Solutions received several orders from government tenders and through our distribution network for storage systems that are destined for use in storing pandemic related materials. 16

© 2021 Cryoport, Inc. All Rights Reserved Financial Overview
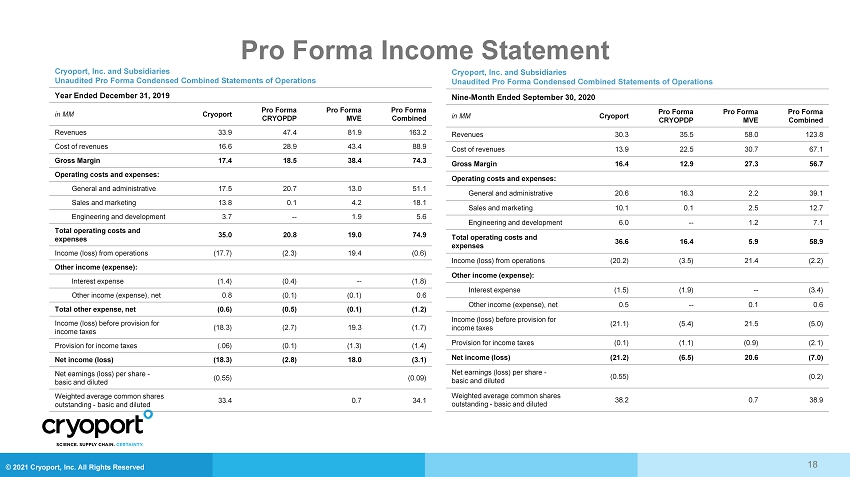
© 2021 Cryoport, Inc. All Rights Reserved Pro Forma Income Statement 18 Cryoport , Inc. and Subsidiaries Unaudited Pro Forma Condensed Combined Statements of Operations Year Ended December 31, 2019 in MM Cryoport Pro Forma CRYOPDP Pro Forma MVE Pro Forma Combined Revenues 33.9 47.4 81.9 163.2 Cost of revenues 16.6 28.9 43.4 88.9 Gross Margin 17.4 18.5 38.4 74.3 Operating costs and expenses: General and administrative 17.5 20.7 13.0 51.1 Sales and marketing 13.8 0.1 4.2 18.1 Engineering and development 3.7 -- 1.9 5.6 Total operating costs and expenses 35.0 20.8 19.0 74.9 Income (loss) from operations (17.7) (2.3) 19.4 (0.6) Other income (expense): Interest expense (1.4) (0.4) -- (1.8) Other income (expense), net 0.8 (0.1) (0.1) 0.6 Total other expense, net (0.6) (0.5) (0.1) (1.2) Income (loss) before provision for income taxes (18.3) (2.7) 19.3 (1.7) Provision for income taxes (.06) (0.1) (1.3) (1.4) Net income (loss) (18.3) (2.8) 18.0 (3.1) Net earnings (loss) per share - basic and diluted (0.55) (0.09) Weighted average common shares outstanding - basic and diluted 33.4 0.7 34.1 Cryoport , Inc. and Subsidiaries Unaudited Pro Forma Condensed Combined Statements of Operations Nine - Month Ended September 30, 2020 in MM Cryoport Pro Forma CRYOPDP Pro Forma MVE Pro Forma Combined Revenues 30.3 35.5 58.0 123.8 Cost of revenues 13.9 22.5 30.7 67.1 Gross Margin 16.4 12.9 27.3 56.7 Operating costs and expenses: General and administrative 20.6 16.3 2.2 39.1 Sales and marketing 10.1 0.1 2.5 12.7 Engineering and development 6.0 -- 1.2 7.1 Total operating costs and expenses 36.6 16.4 5.9 58.9 Income (loss) from operations (20.2) (3.5) 21.4 (2.2) Other income (expense): Interest expense (1.5) (1.9) -- (3.4) Other income (expense), net 0.5 -- 0.1 0.6 Income (loss) before provision for income taxes (21.1) (5.4) 21.5 (5.0) Provision for income taxes (0.1) (1.1) (0.9) (2.1) Net income (loss) (21.2) (6.5) 20.6 (7.0) Net earnings (loss) per share - basic and diluted (0.55) (0.2) Weighted average common shares outstanding - basic and diluted 38.2 0.7 38.9
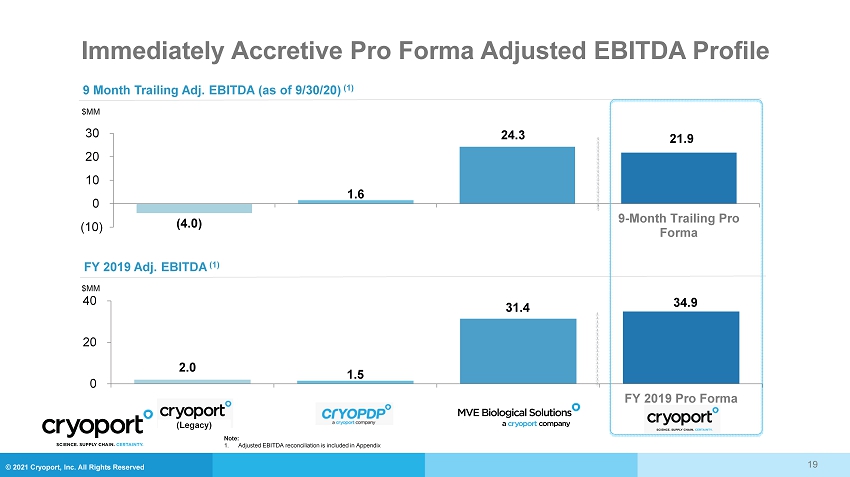
© 2021 Cryoport, Inc. All Rights Reserved Immediately Accretive Pro Forma Adjusted EBITDA Profile 19 (4.0) 1.6 24.3 21.9 (10.0) 0.0 10.0 20.0 30.0 (10) 0 10 20 30 9-Month Trailing Pro Forma $MM 9 Month Trailing Adj. EBITDA (as of 9/30/20) (1) FY 2019 Adj. EBITDA (1) $MM 2.0 1.5 31.4 34.9 0.0 20.0 40.0 0 20 40 FY 2019 Pro Forma (Legacy) Note: 1. Adjusted EBITDA reconciliation is included in Appendix
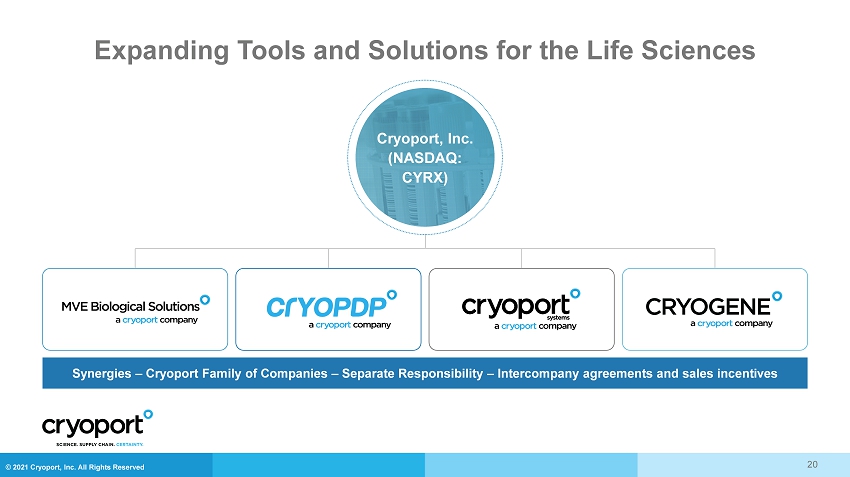
© 2021 Cryoport, Inc. All Rights Reserved Expanding Tools and Solutions for the Life Sciences Synergies – Cryoport Family of Companies – Separate Responsibility – Intercompany agreements and sales incentives Cryoport, Inc. (NASDAQ: CYRX) 20
© 2021 Cryoport, Inc. All Rights Reserved Summary 21 End - to - end solutions platform offering fully integrated temperature controlled supply chain solutions for the life sciences Well positioned to take advantage of the growing needs in the cell & gene therapy market A market leader with long - term client agreements and diverse client base Leading, proprietary solutions: Cryoportal ® Logistics Management Platform, Smartpak II ® Condition Monitoring System technology and Cryoport Express ® shipper fleet A global leader in cryogenic manufacturing Third largest healthcare focused specialty logistics provider by revenue Operating holding company platform in place for future growth Financial partnership with Blackstone Strong revenue performance
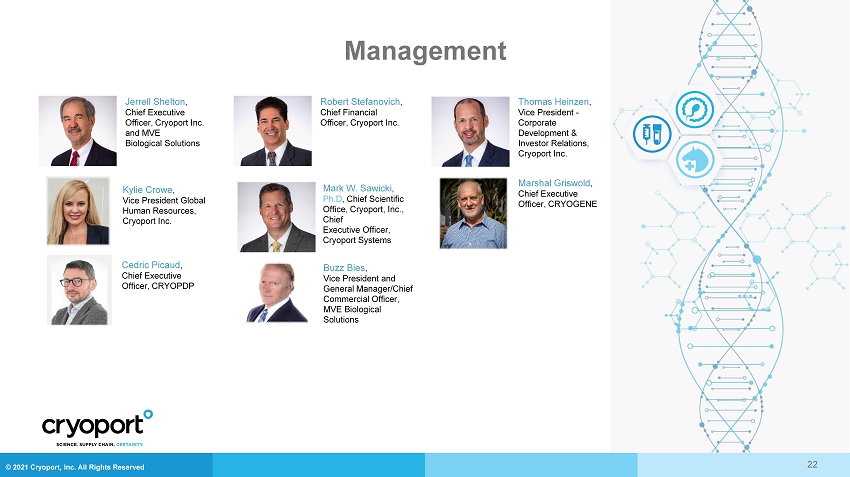
© 2021 Cryoport, Inc. All Rights Reserved Management 22 Jerrell Shelton , Chief Executive Officer, Cryoport Inc. and MVE Biological Solutions Robert Stefanovich , Chief Financial Officer, Cryoport Inc. Mark W. Sawicki , Ph.D , Chief Scientific Office, Cryoport, Inc., Chief Executive Officer, Cryoport Systems Marshal Griswold , Chief Executive Officer, CRYOGENE PHOTO Cedric Picaud , Chief Executive Officer, CRYOPDP Thomas Heinzen , Vice President - Corporate Development & Investor Relations, Cryoport Inc. Buzz Bies , Vice President and General Manager/Chief Commercial Officer, MVE Biological Solutions PHOTO Kylie Crowe , Vice President Global Human Resources, Cryoport Inc.
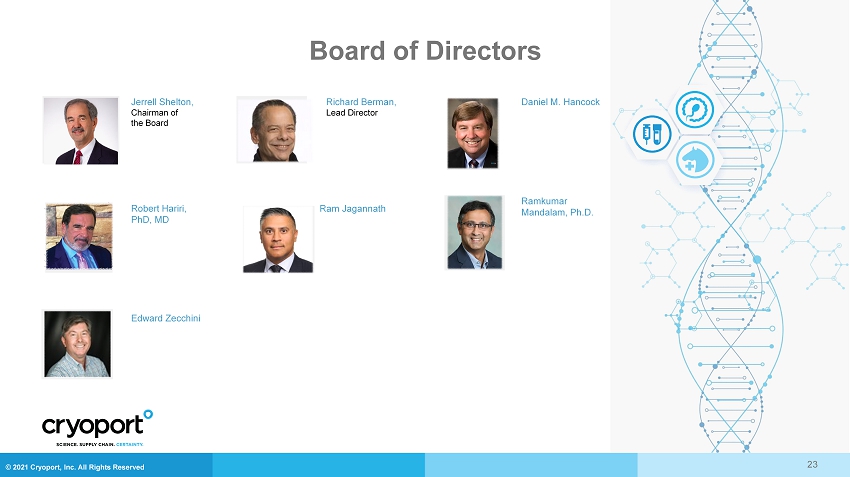
© 2021 Cryoport, Inc. All Rights Reserved Board of Directors 23 Jerrell Shelton, Chairman of the Board Richard Berman, Lead Director Daniel M. Hancock PHOTO PHOTO PHOTO Robert Hariri, PhD, MD PHOTO Ramkumar Mandalam, Ph.D. PHOTO Edward Zecchini PHOTO Ram Jagannath PHOTO

© 2021 Cryoport, Inc. All Rights Reserved 24 Science. Logistics. Certainty. Thank you!

© 2021 Cryoport, Inc. All Rights Reserved Supplementary Materials
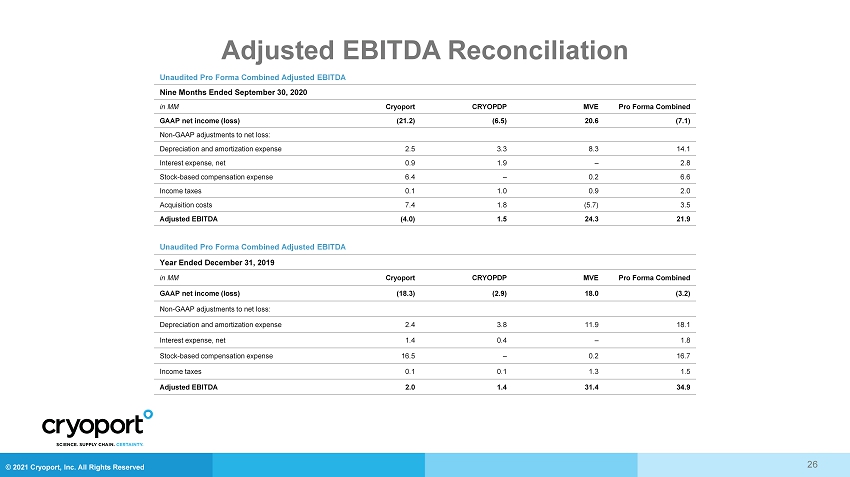
© 2021 Cryoport, Inc. All Rights Reserved Adjusted EBITDA Reconciliation 26 Unaudited Pro Forma Combined Adjusted EBITDA Nine Months Ended September 30, 2020 in MM Cryoport CRYOPDP MVE Pro Forma Combined GAAP net income (loss) (21.2) (6.5) 20.6 (7.1) Non - GAAP adjustments to net loss: Depreciation and amortization expense 2.5 3.3 8.3 14.1 Interest expense, net 0.9 1.9 – 2.8 Stock - based compensation expense 6.4 – 0.2 6.6 Income taxes 0.1 1.0 0.9 2.0 Acquisition costs 7.4 1.8 (5.7) 3.5 Adjusted EBITDA (4.0) 1.5 24.3 21.9 Unaudited Pro Forma Combined Adjusted EBITDA Year Ended December 31, 2019 in MM Cryoport CRYOPDP MVE Pro Forma Combined GAAP net income (loss) (18.3) (2.9) 18.0 (3.2) Non - GAAP adjustments to net loss: Depreciation and amortization expense 2.4 3.8 11.9 18.1 Interest expense, net 1.4 0.4 – 1.8 Stock - based compensation expense 16.5 – 0.2 16.7 Income taxes 0.1 0.1 1.3 1.5 Adjusted EBITDA 2.0 1.4 31.4 34.9